Watch Tower
The Watch Tower is the landing page: one screen of GPU health and security for the selected workspace and time range.
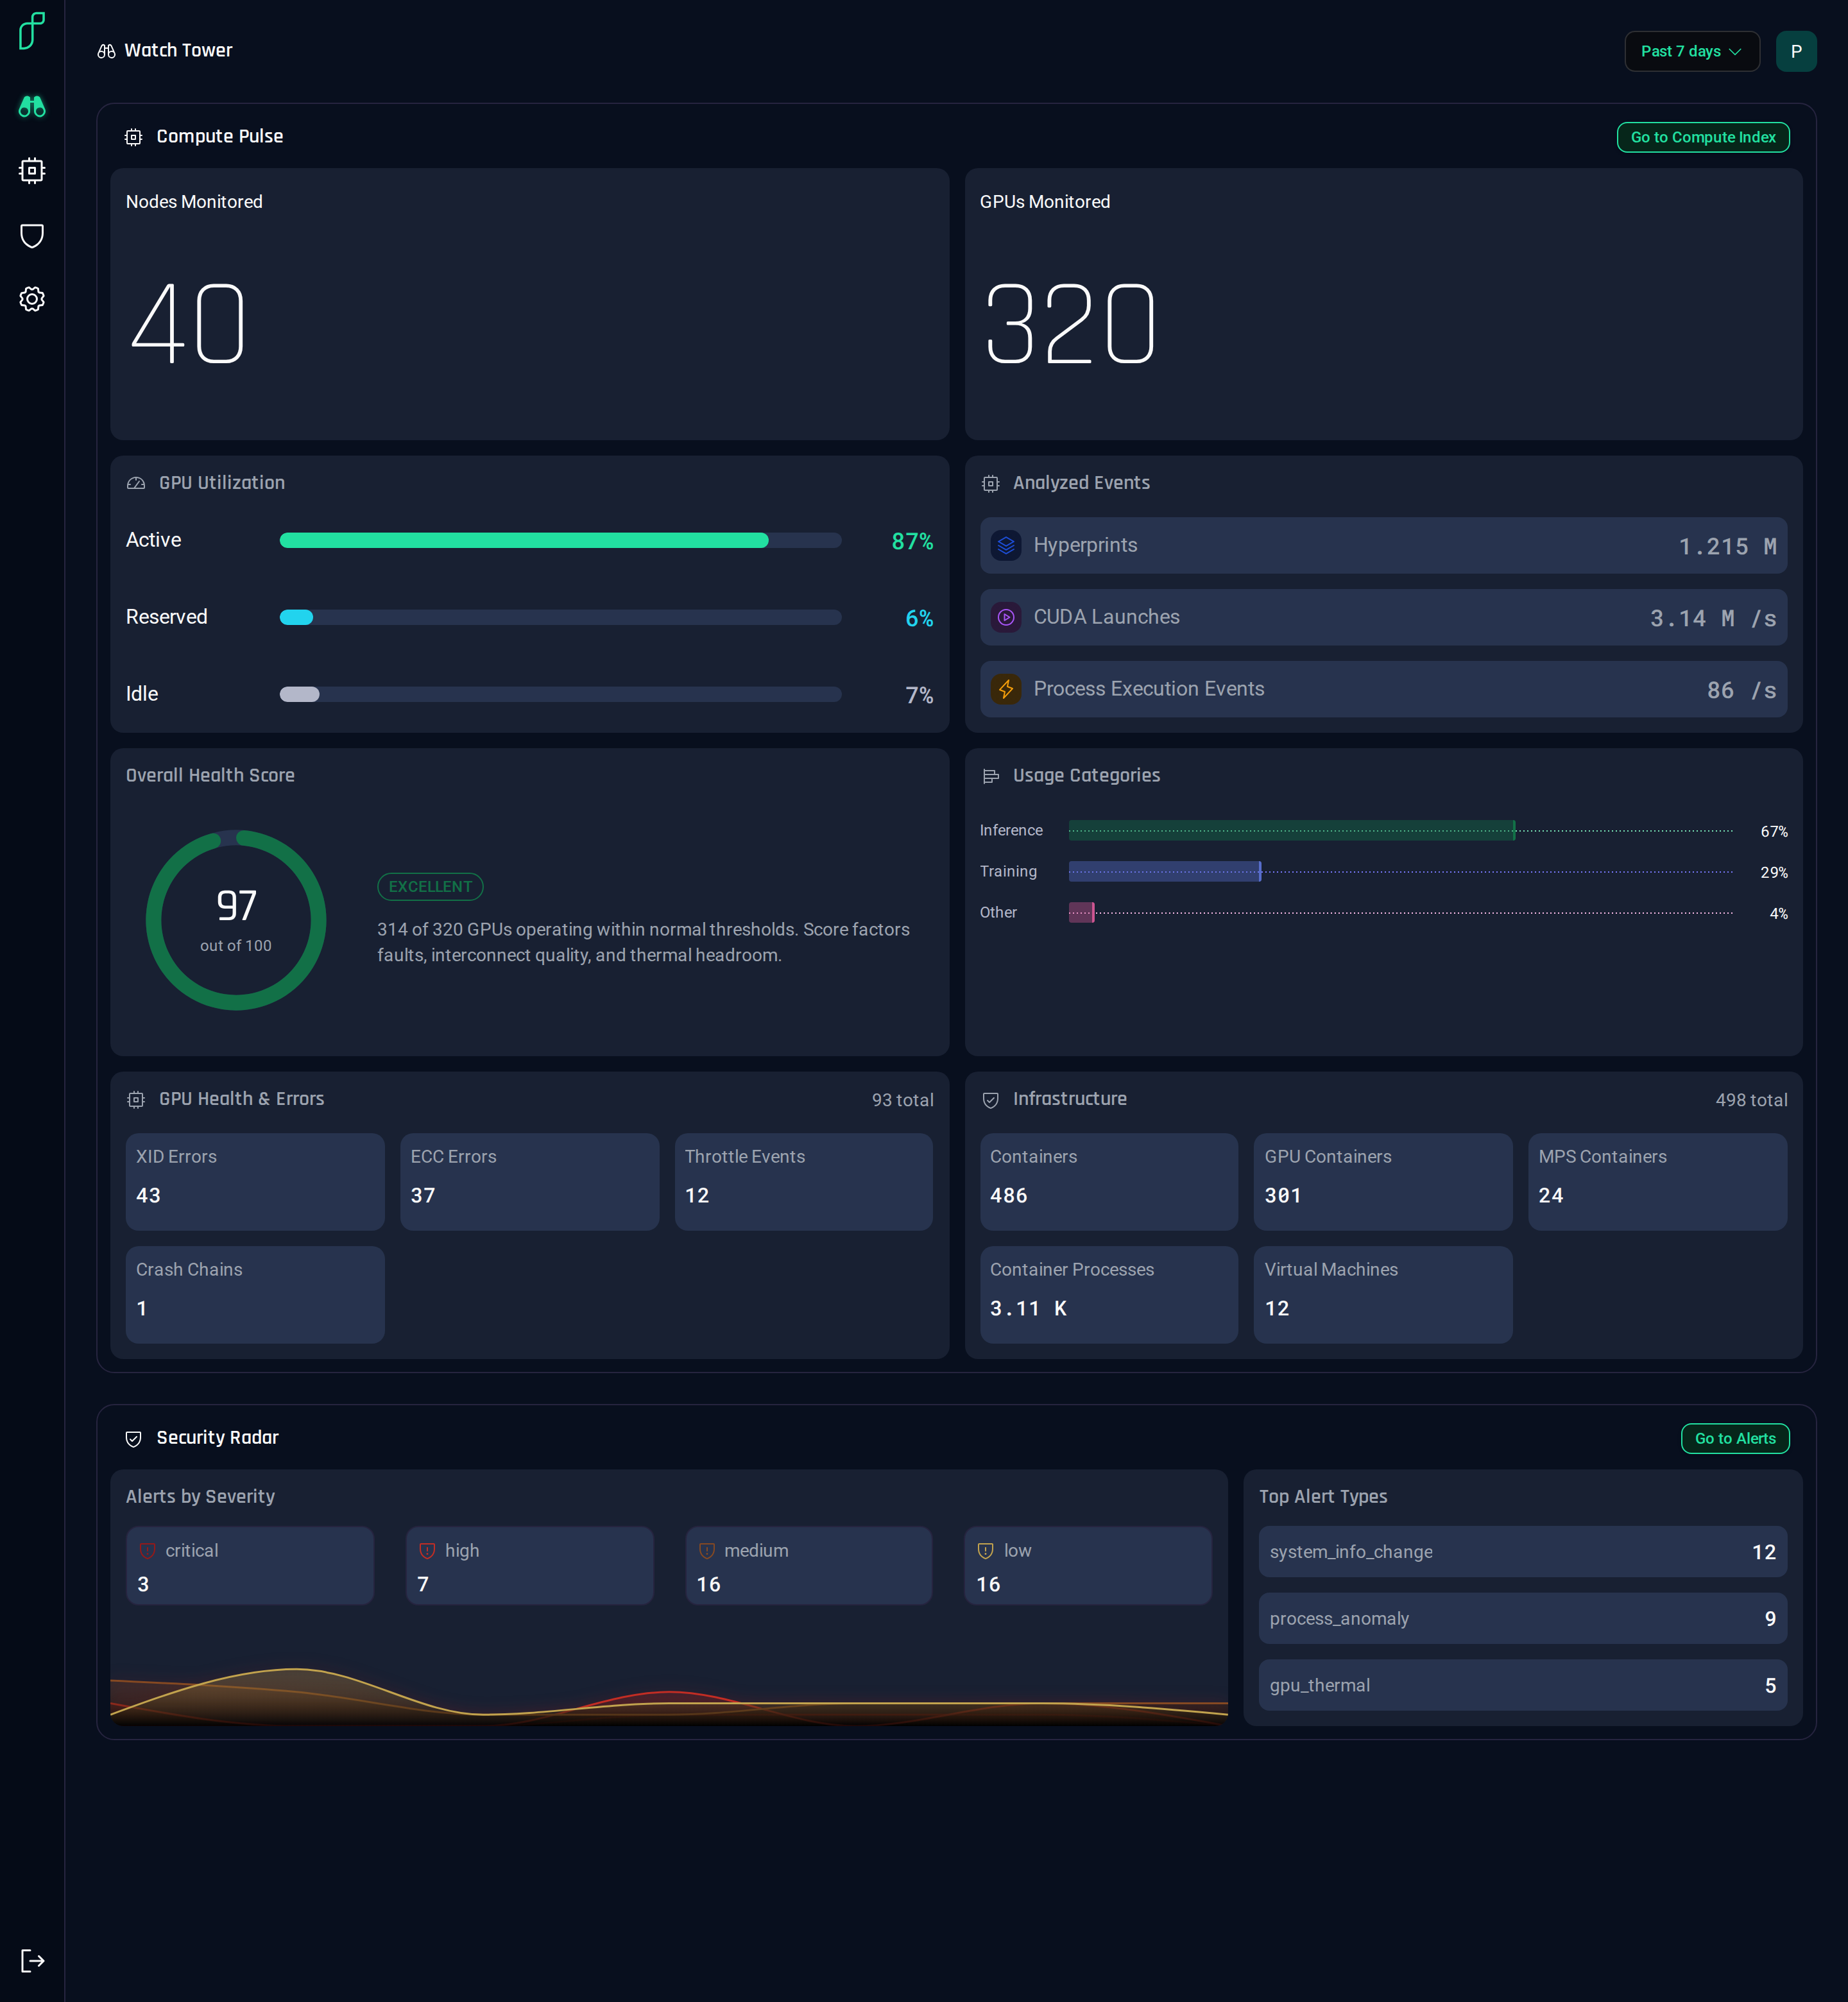
Compute Pulse covers the hardware: nodes and GPUs monitored, how busy they are, analyzed events, the overall health score, what the GPUs are being used for, and error and infrastructure counters. Every number here is a roll-up of the metrics from every node; the Metrics Reference lists each one with its units and what it tells you.
Security Radar covers the alerts: counts by severity with their trend over the window, and the most common alert types. The Alert Types Reference explains the severities and every type.
Jumping off
Each section links to its detailed page.
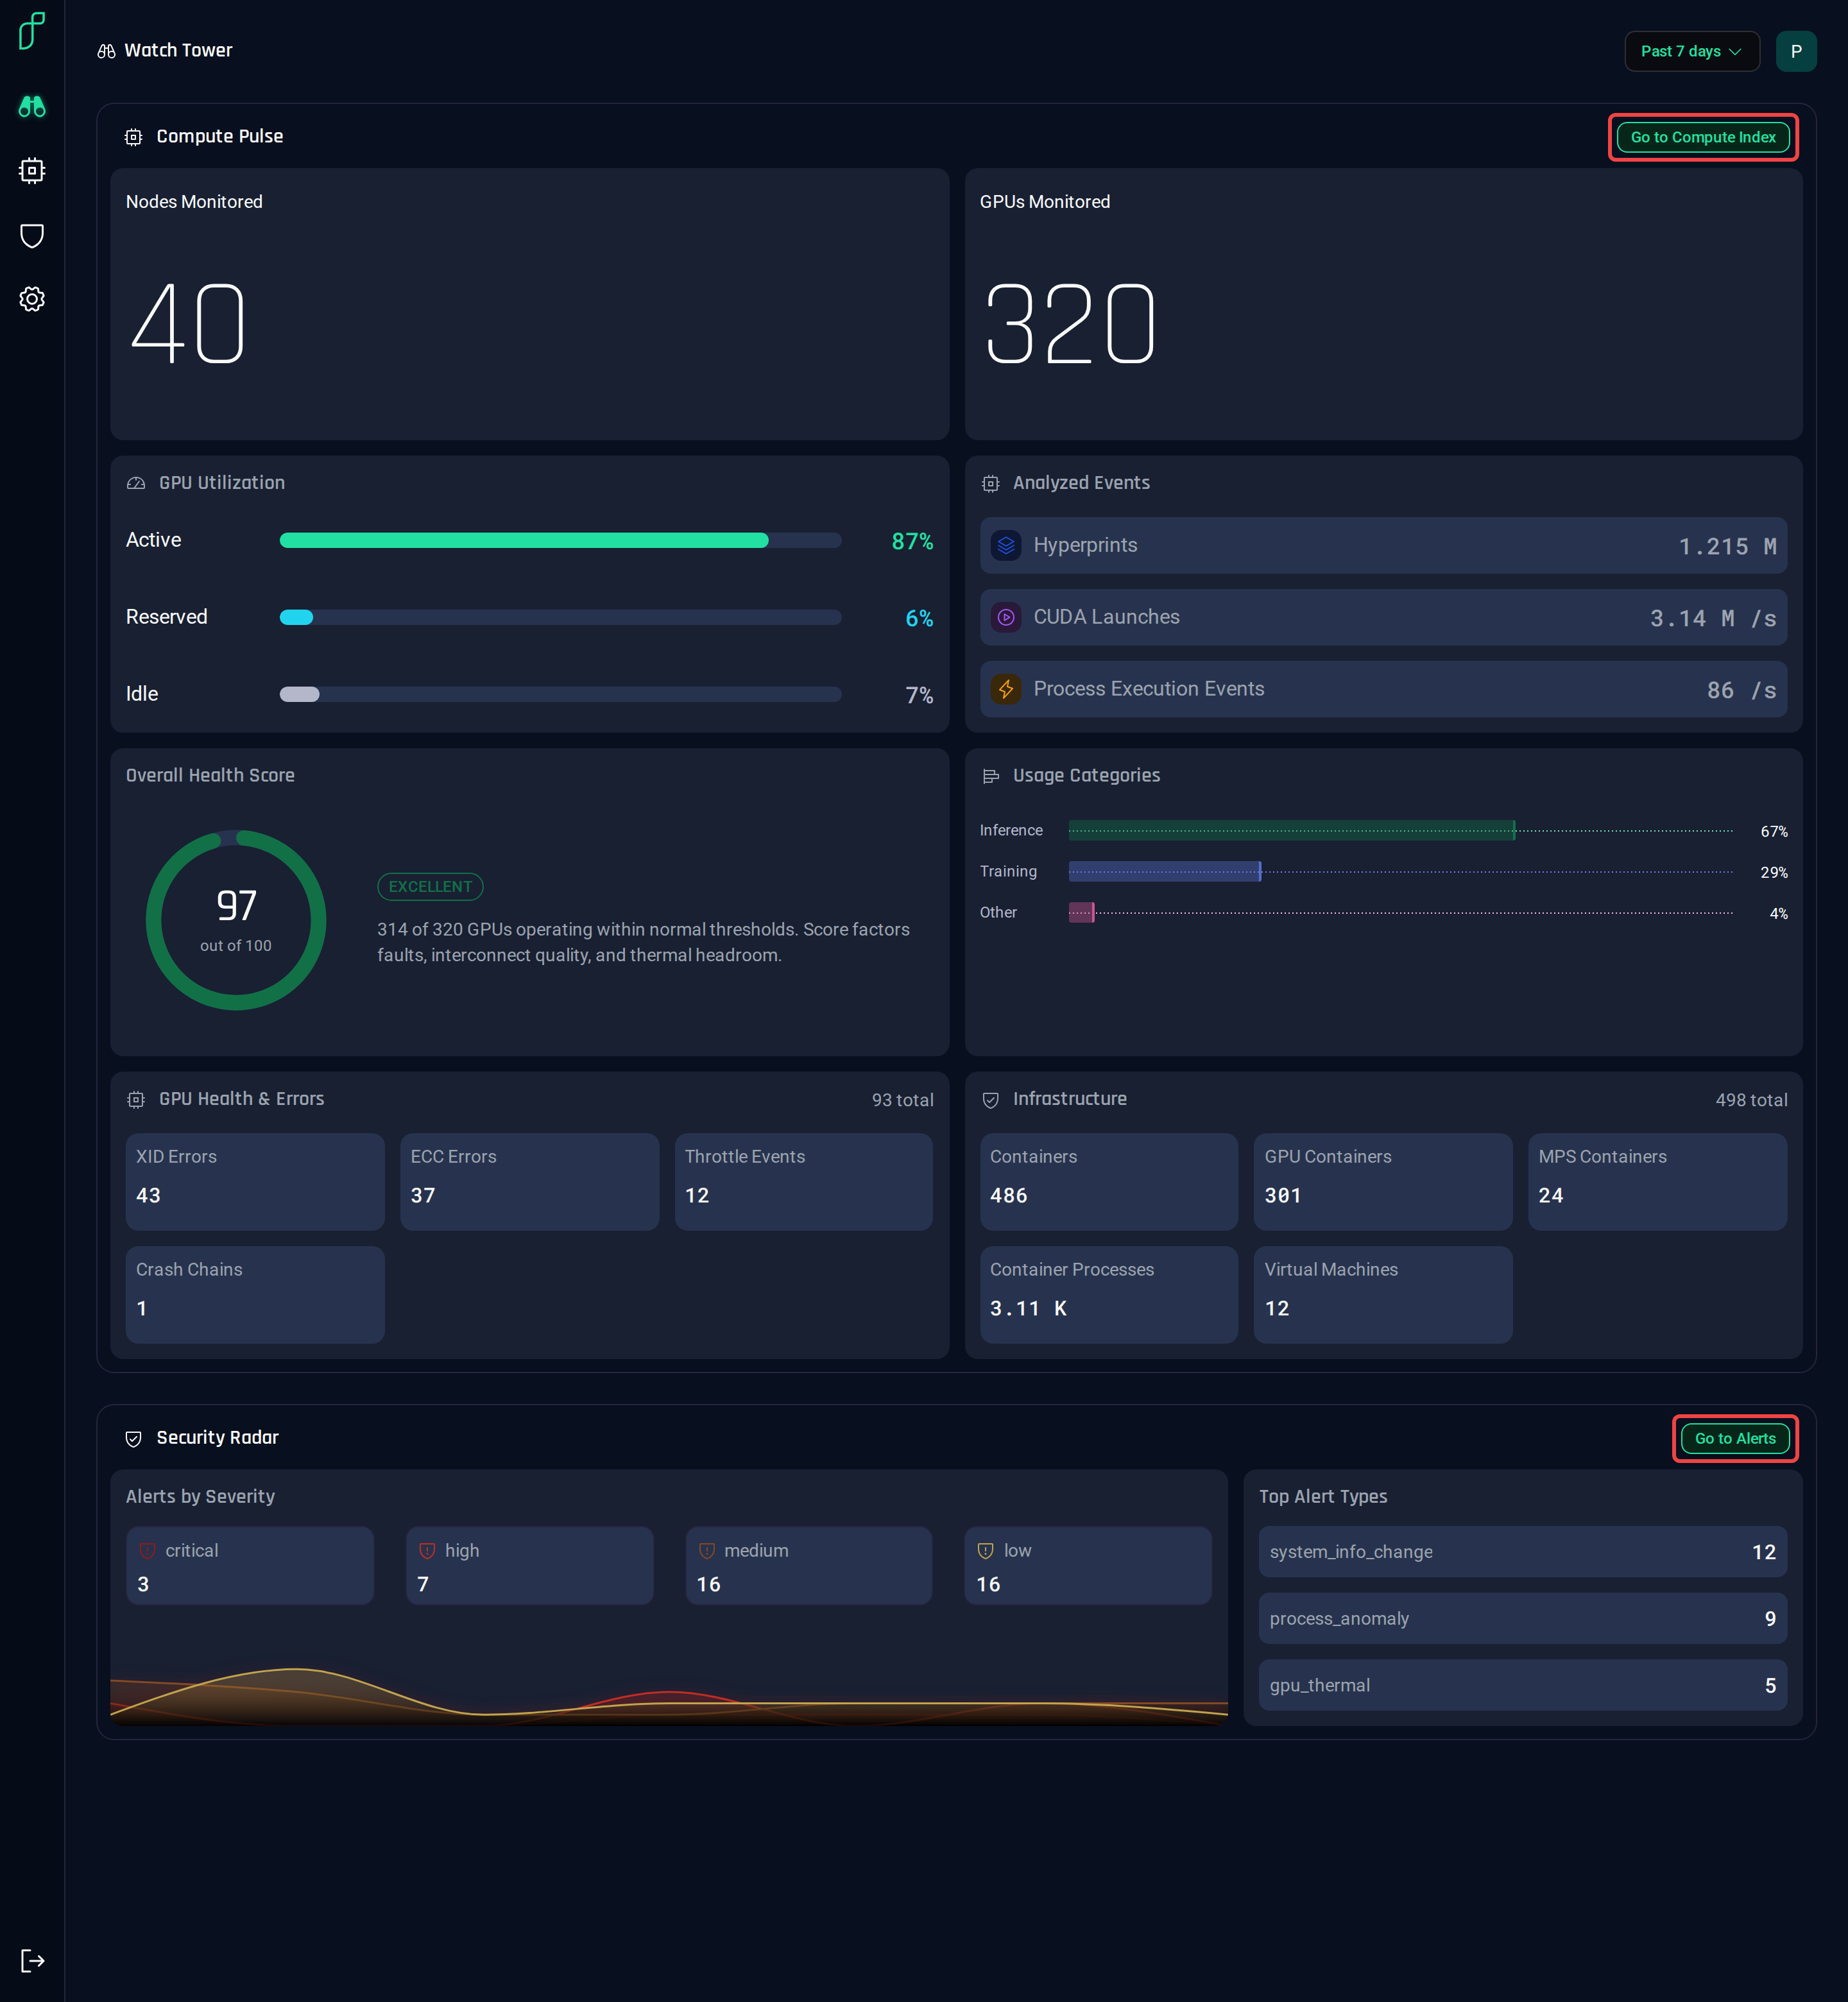
The Watch Tower refreshes itself every minute. Change the workspace or time range in the top-right to look elsewhere.
Going deeper
- The same summary is one API call:
GET /metrics, with a health-at-a-glance recipe in the examples. - Ask an assistant for it instead: the MCP server's
get_fleet_summarytool is listed under Tools. - To chart these metrics in your own stack, export them; see Integrating with Your Environment.