Compute Index
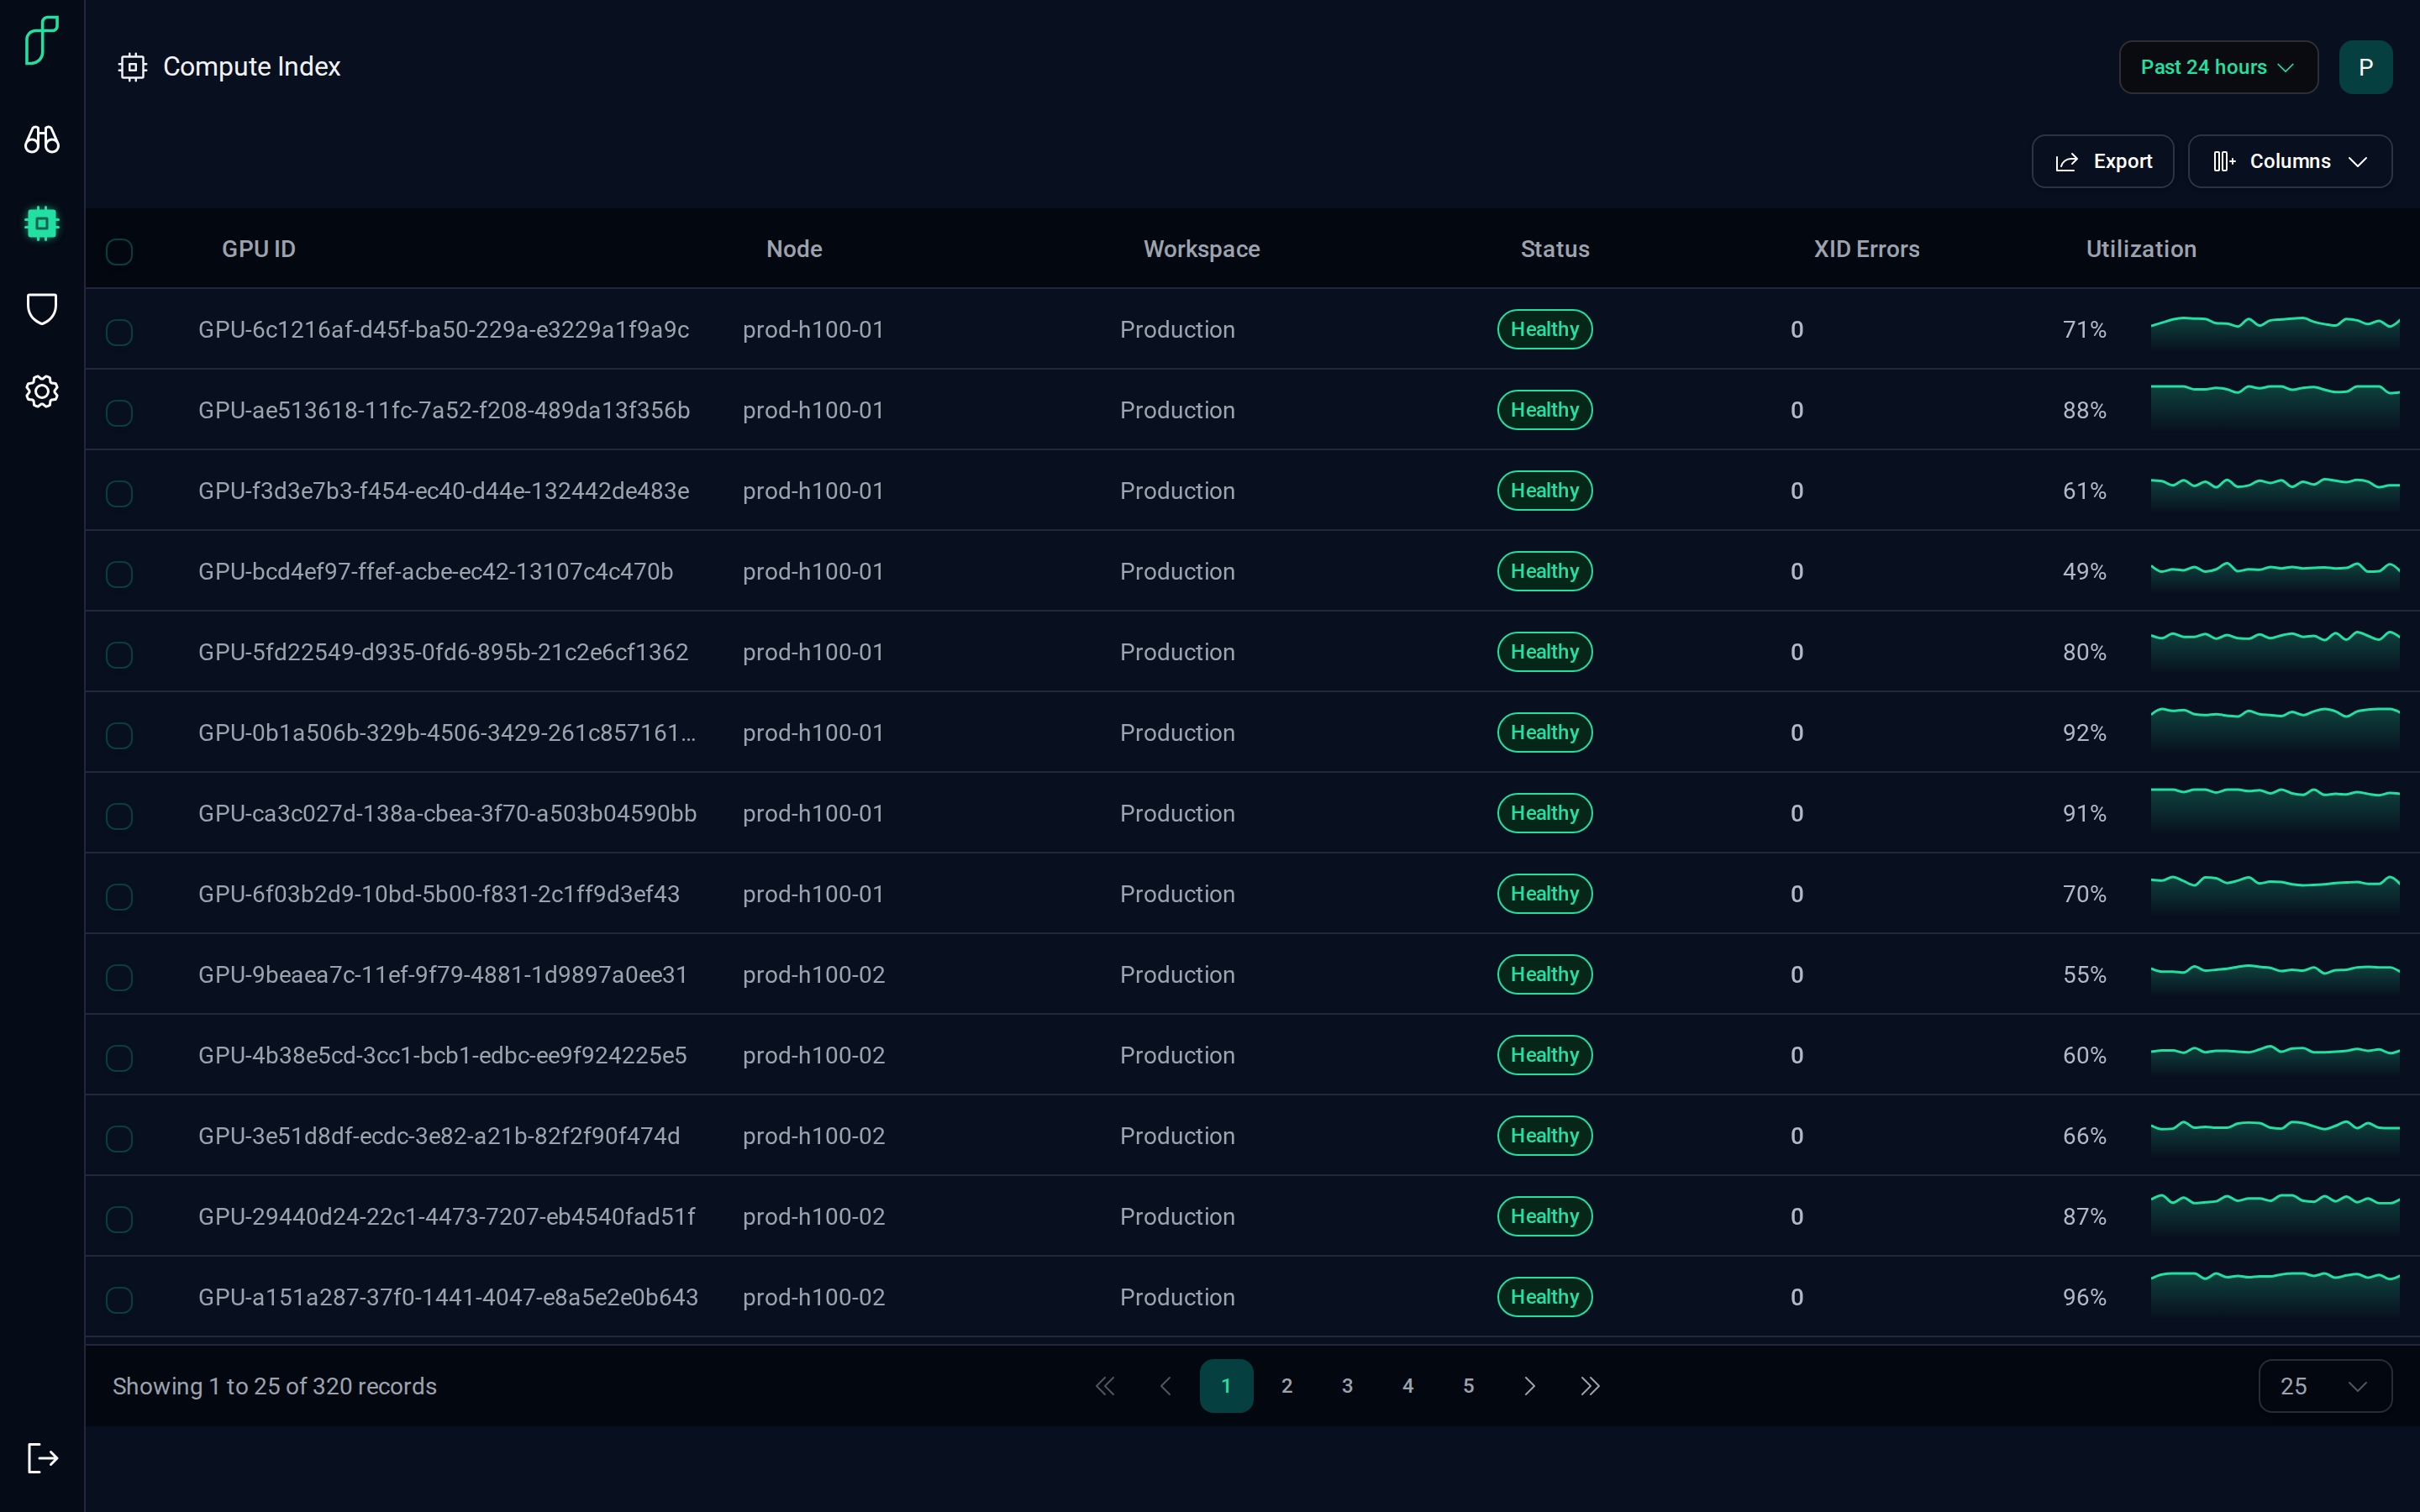
The Compute Index lists every GPU in the workspace with its node, status, XID errors and utilization.
Working with the table
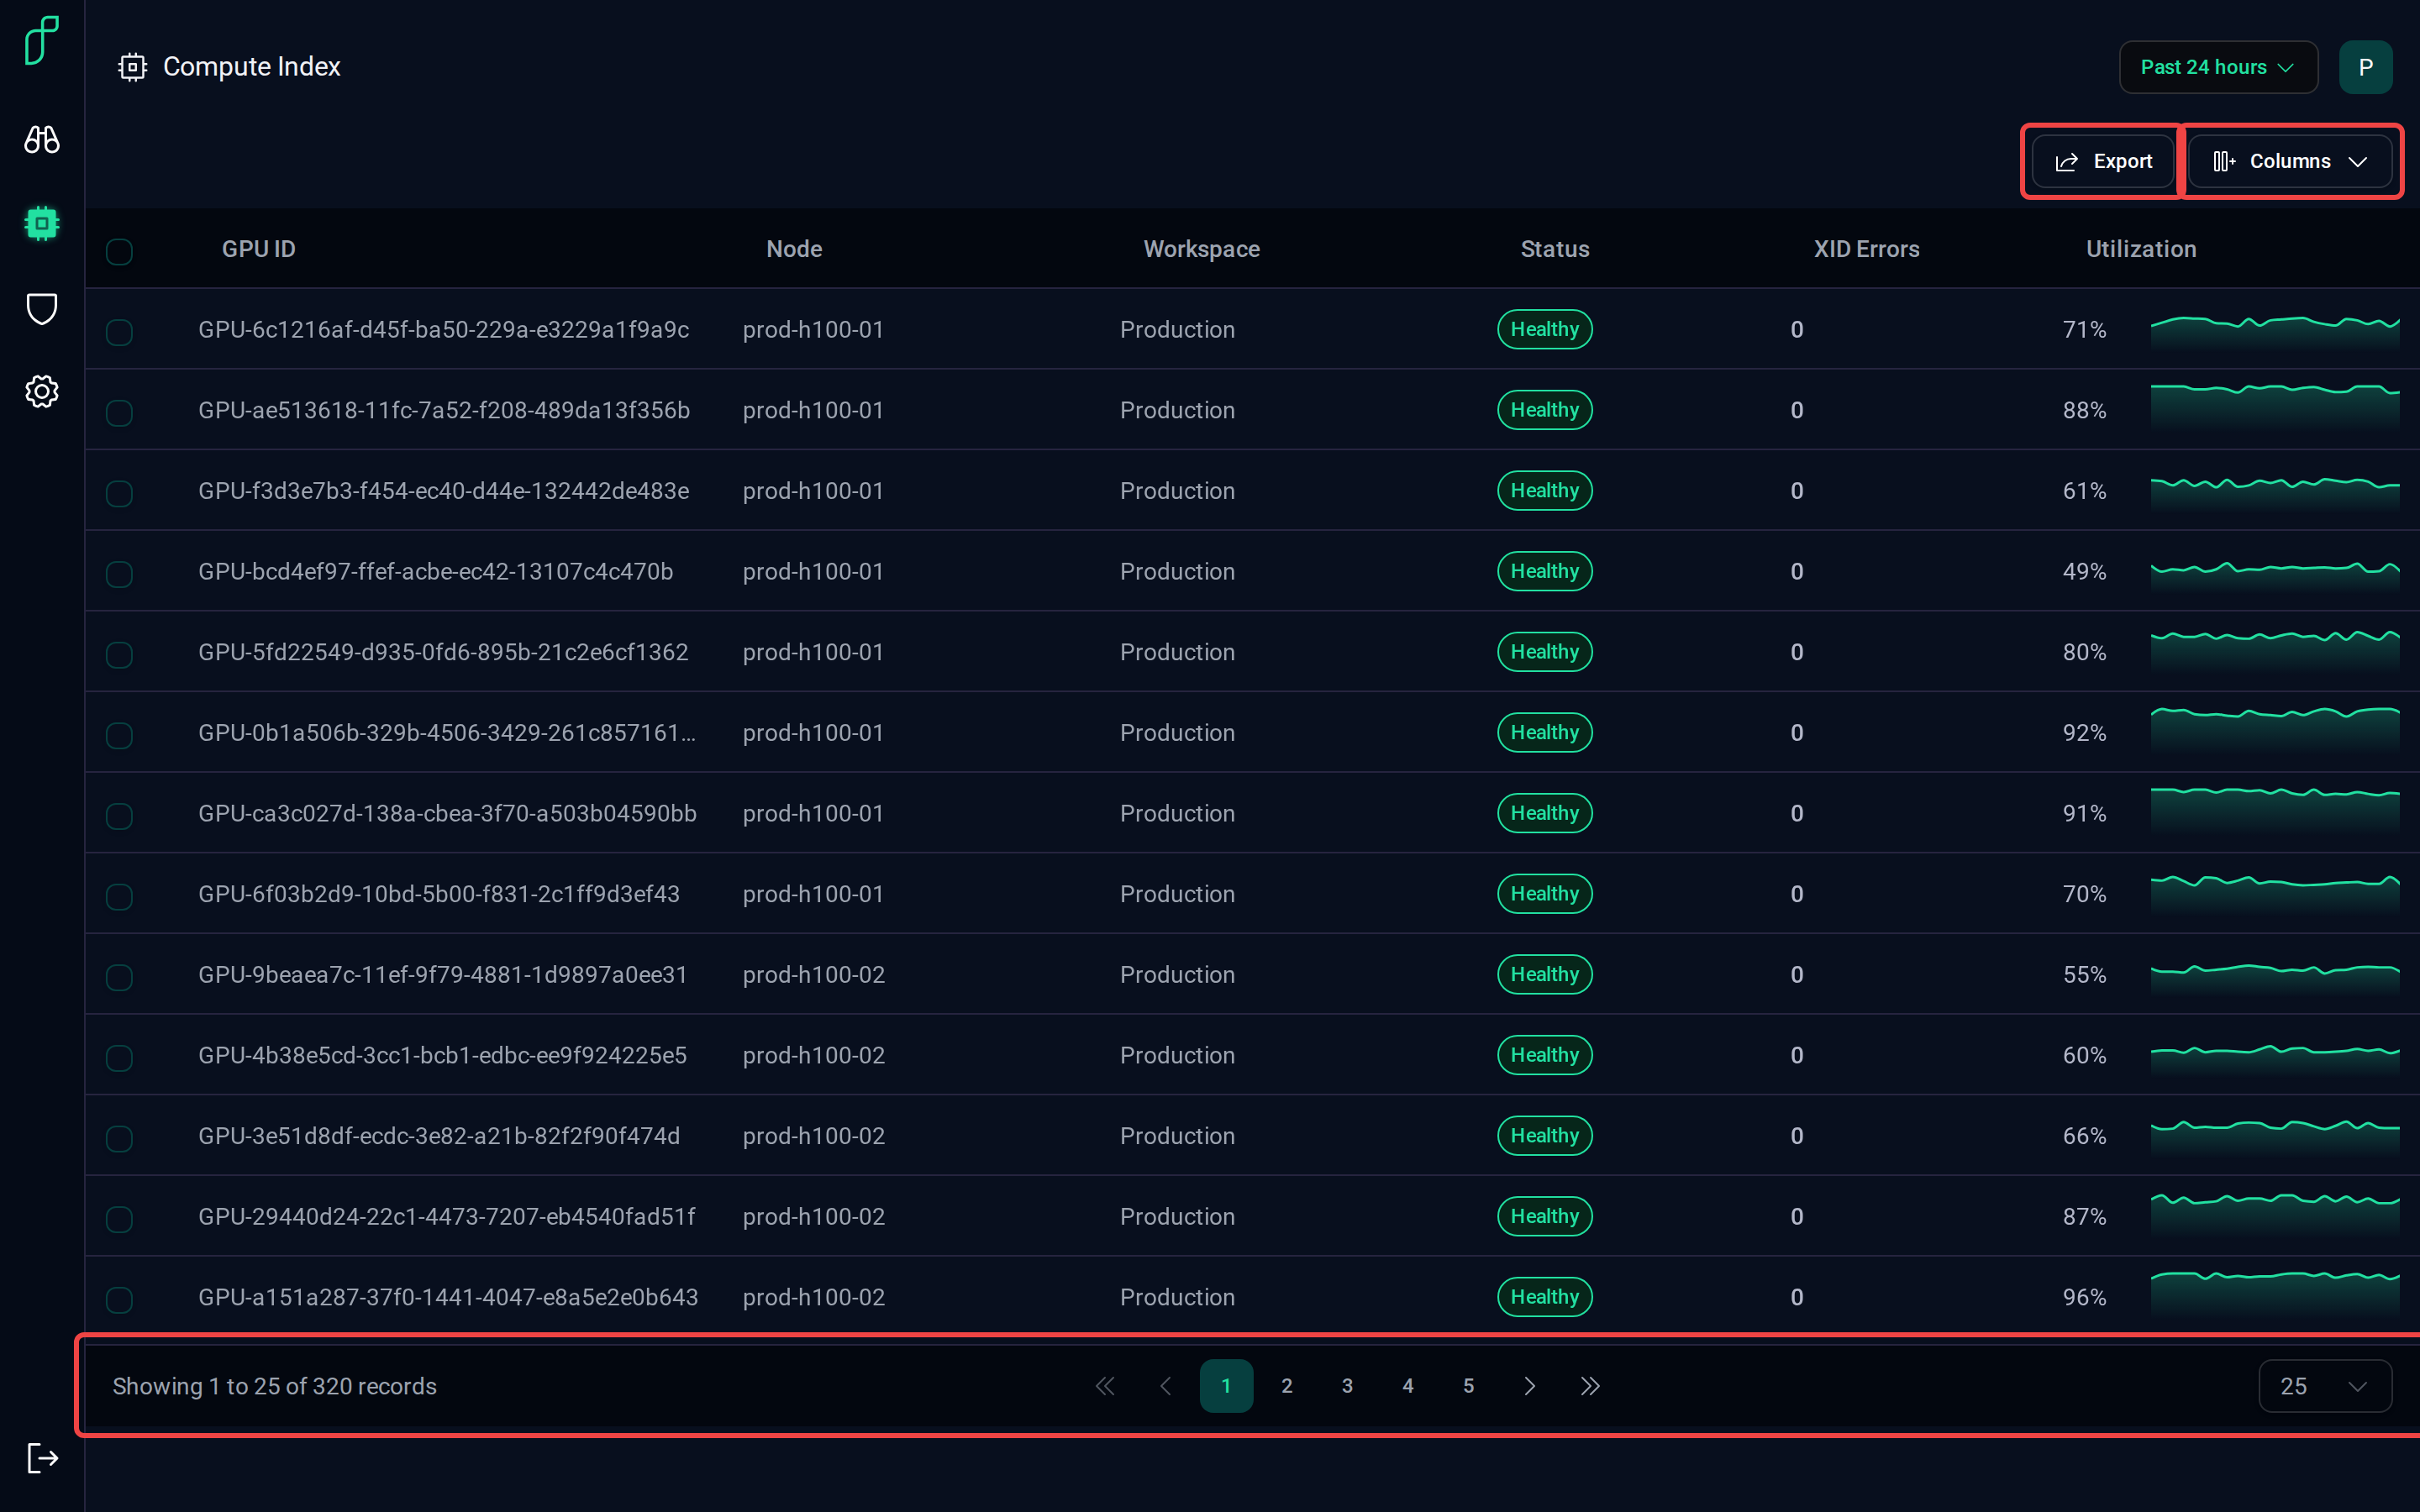
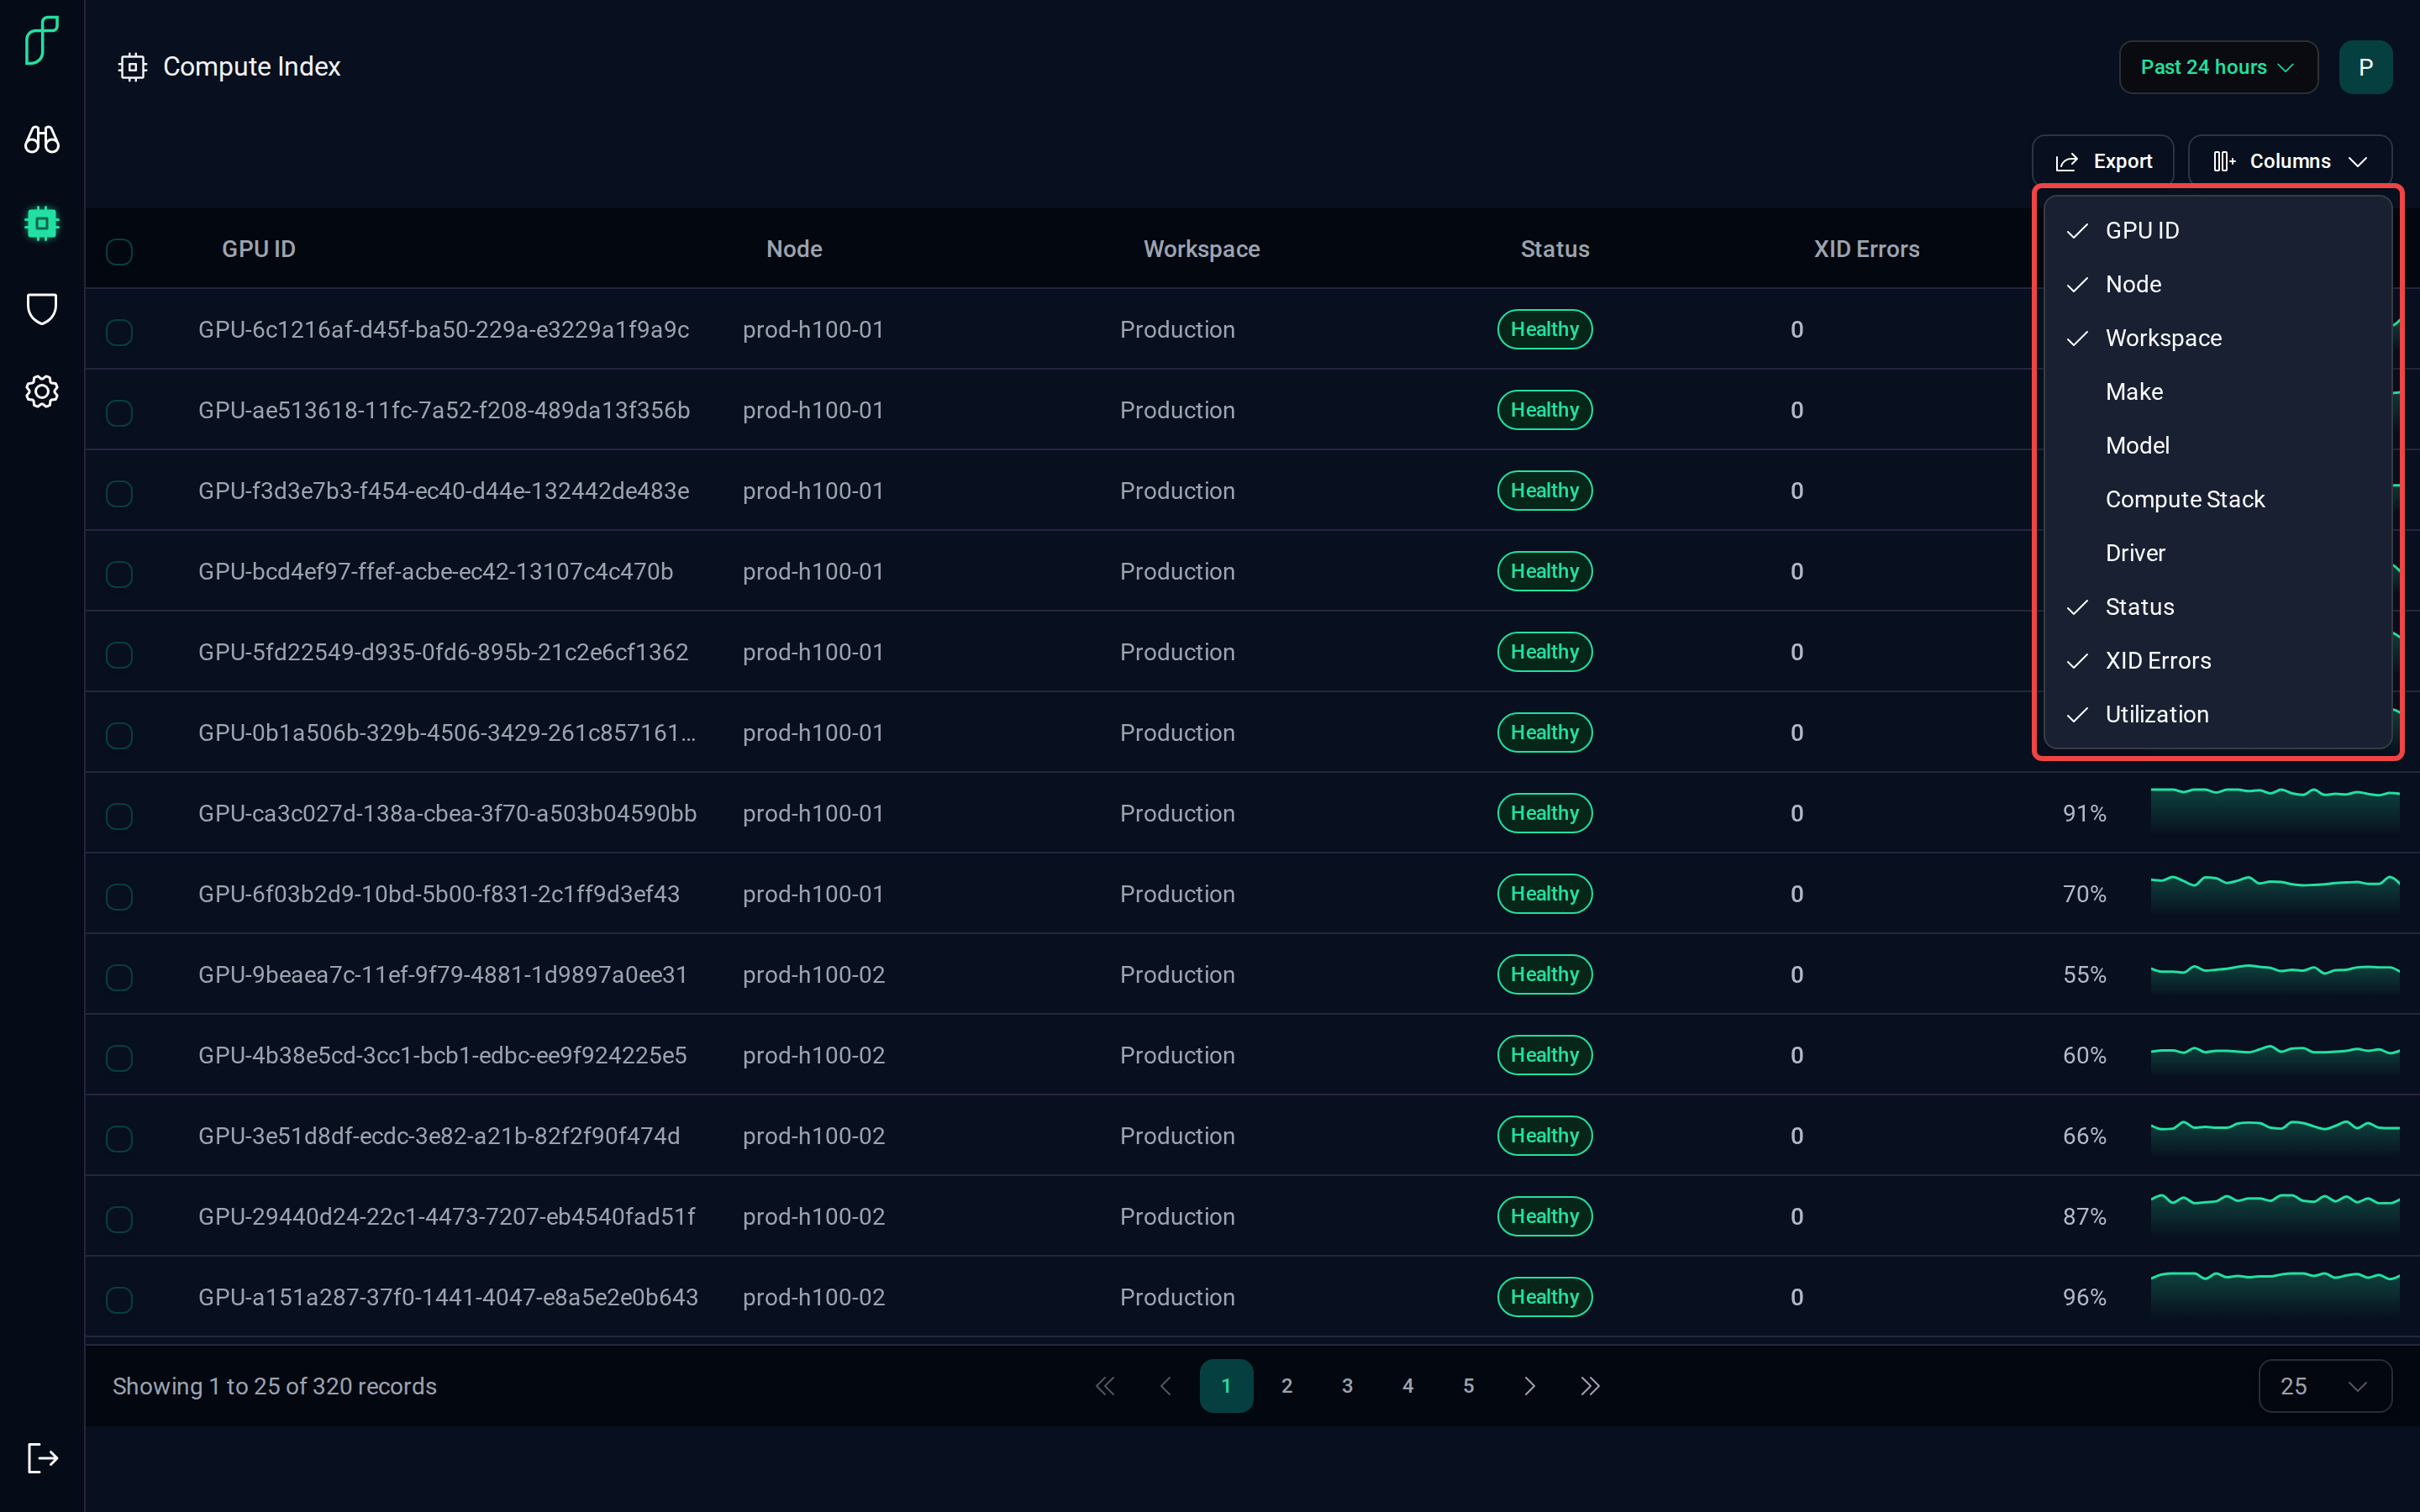
Column headers sort and filter. Export downloads the table as CSV, Columns picks which columns show, and the footer pages through the GPUs.
Opening a GPU
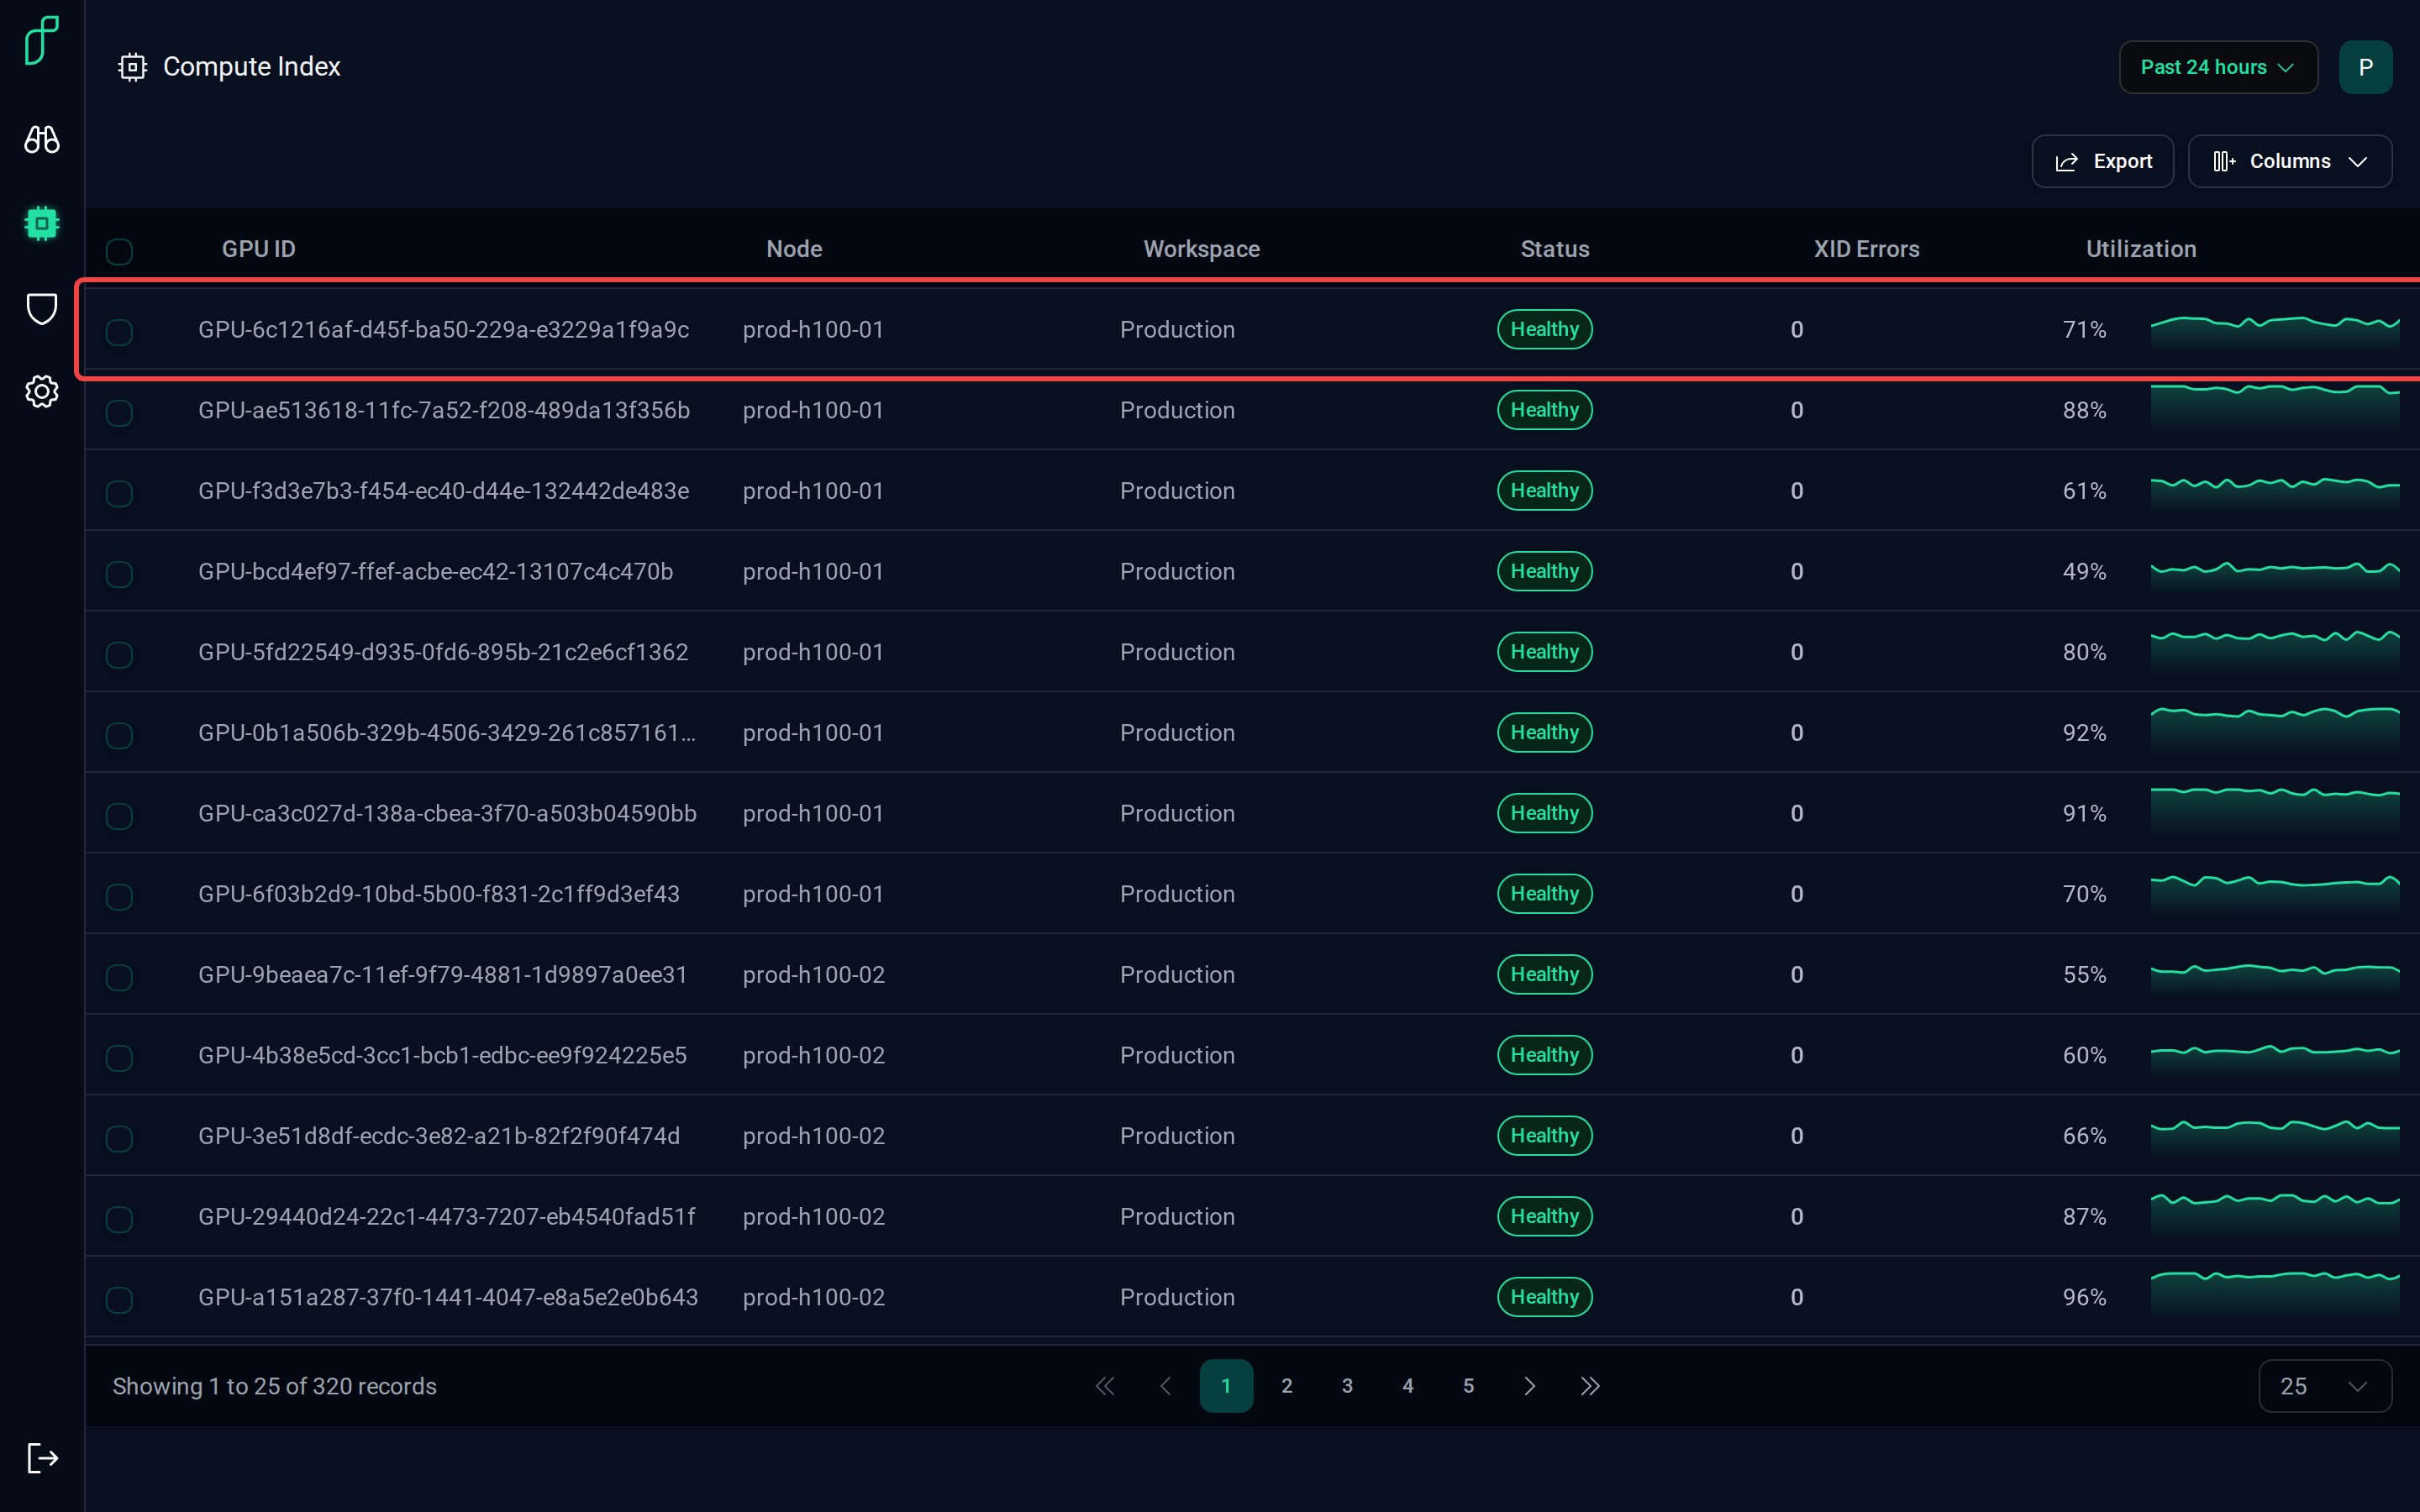
Click a row to open that GPU's details.
GPU details
The side panel holds the GPU's identity, specs, security summary and XID history. The tabs beside it show what the GPU is doing now, how it has been used, and what has gone wrong.
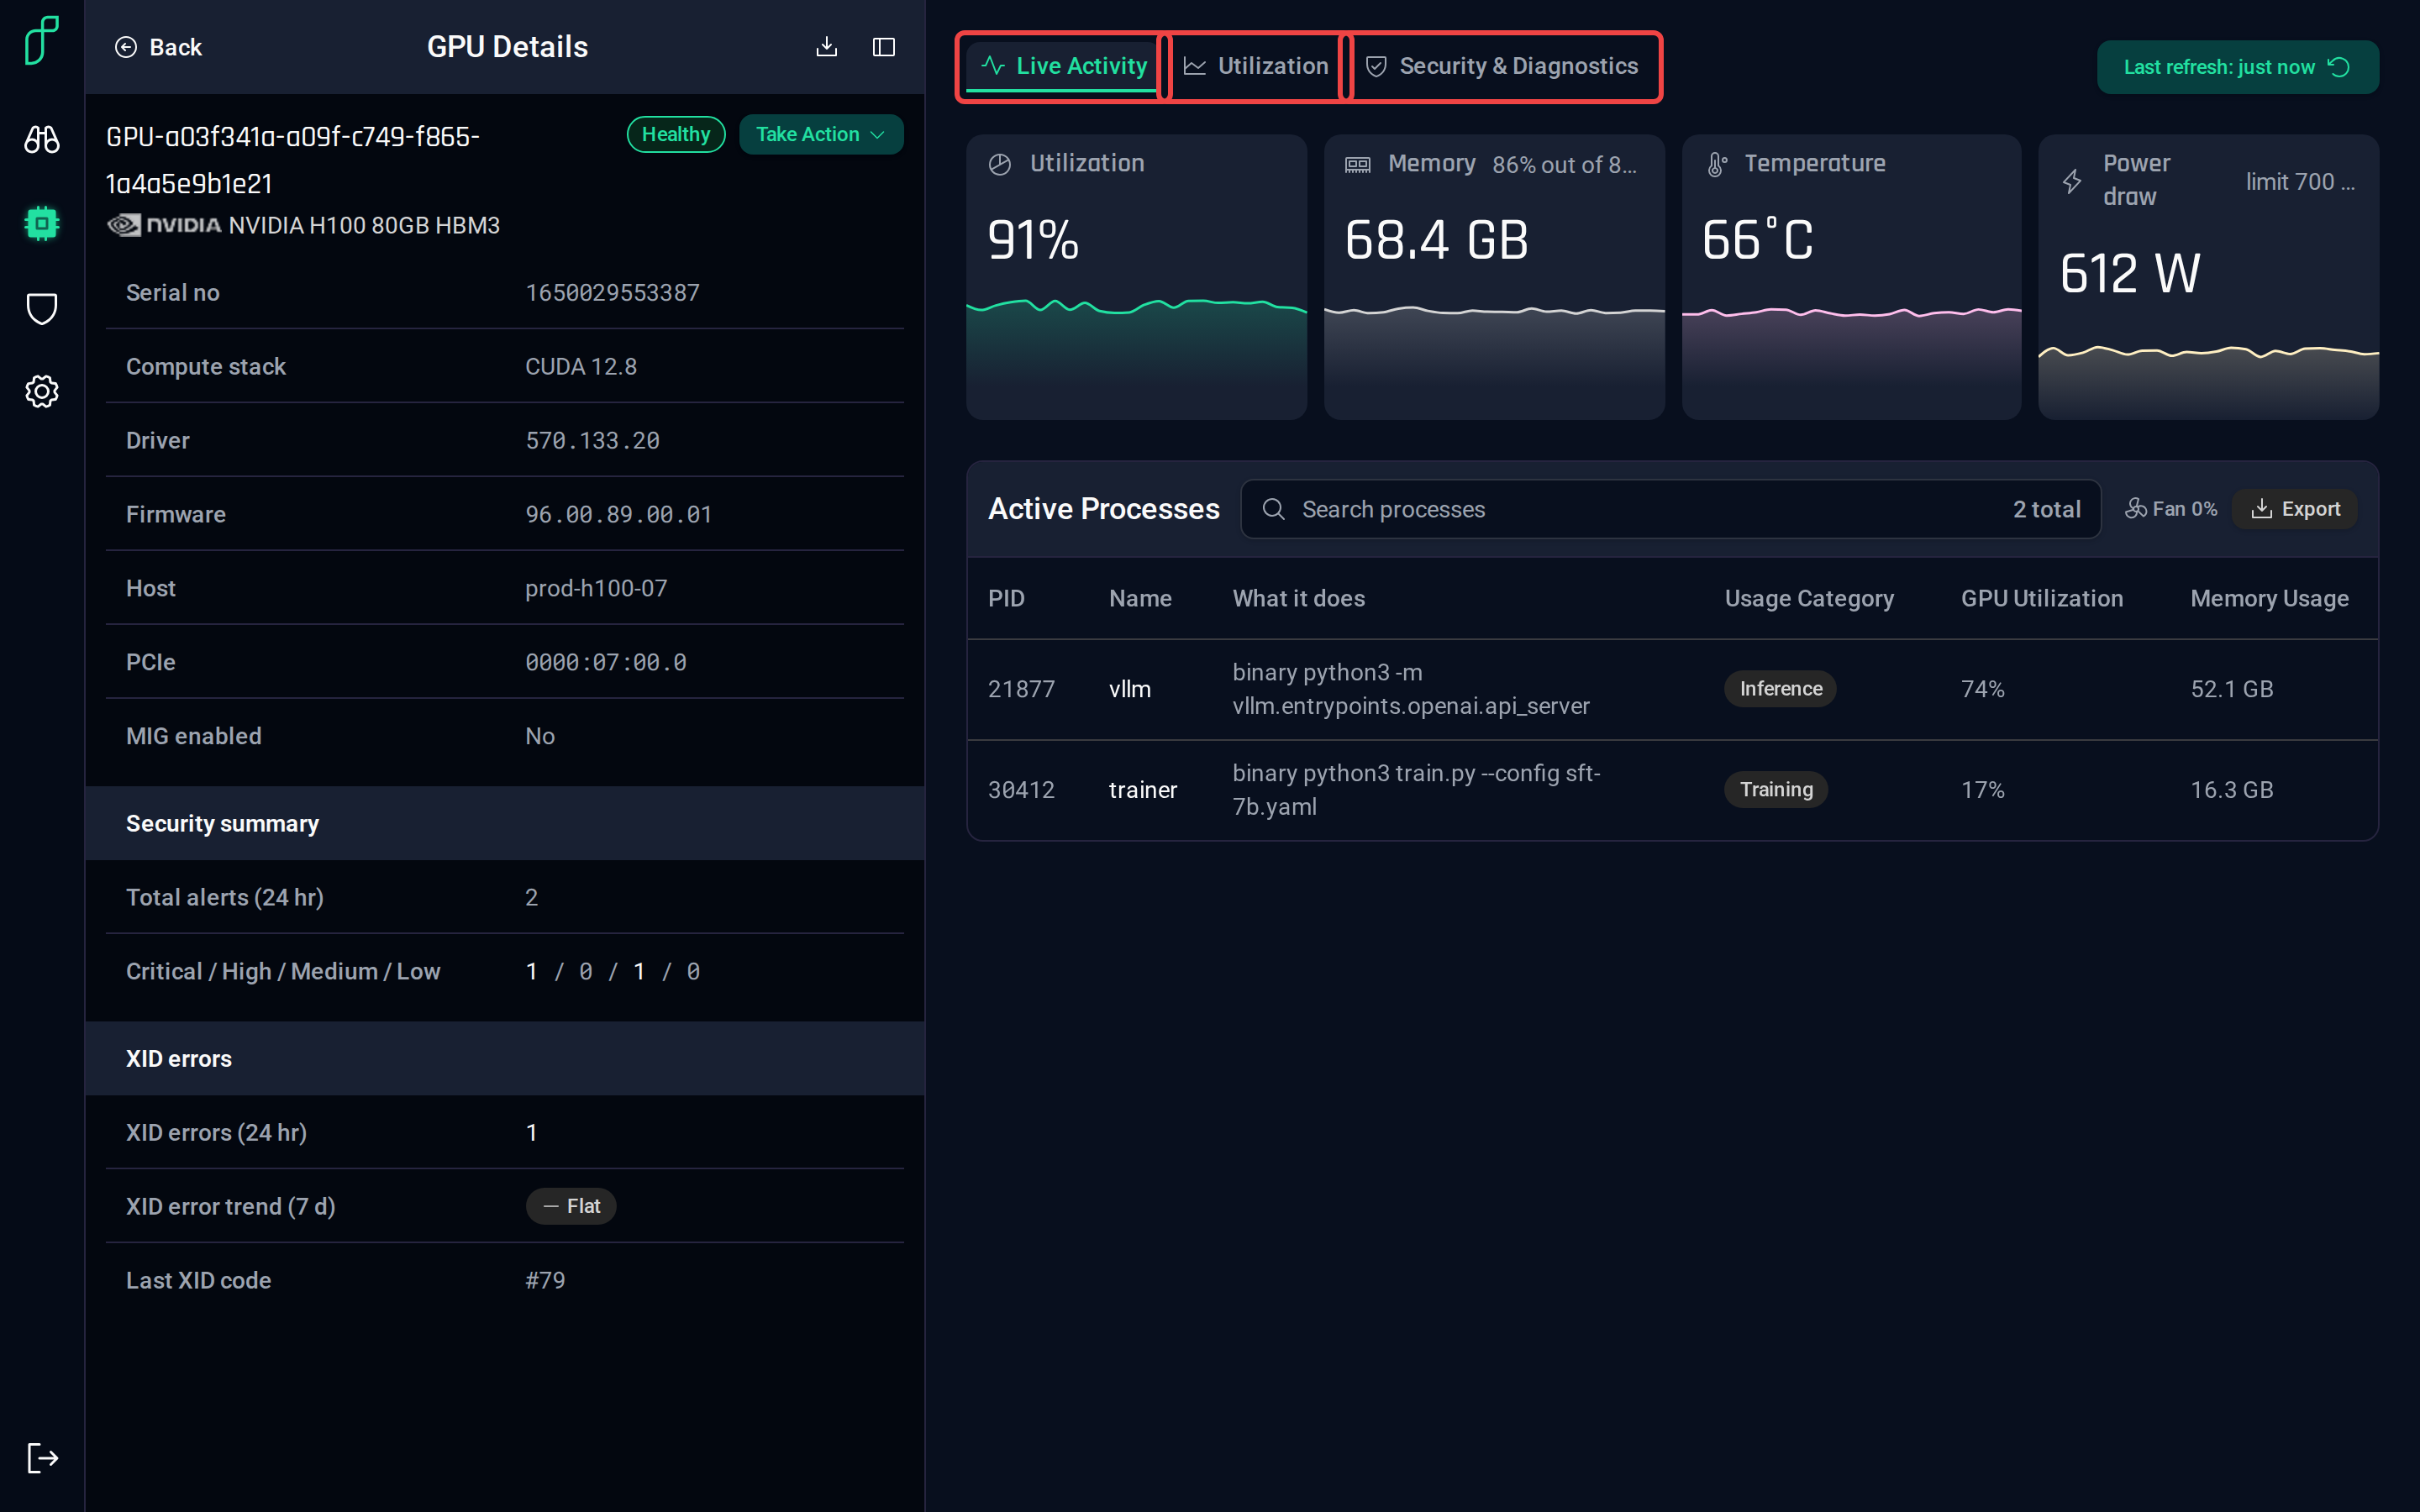
Live Activity — current utilization, memory, temperature and power, and the processes on the GPU.
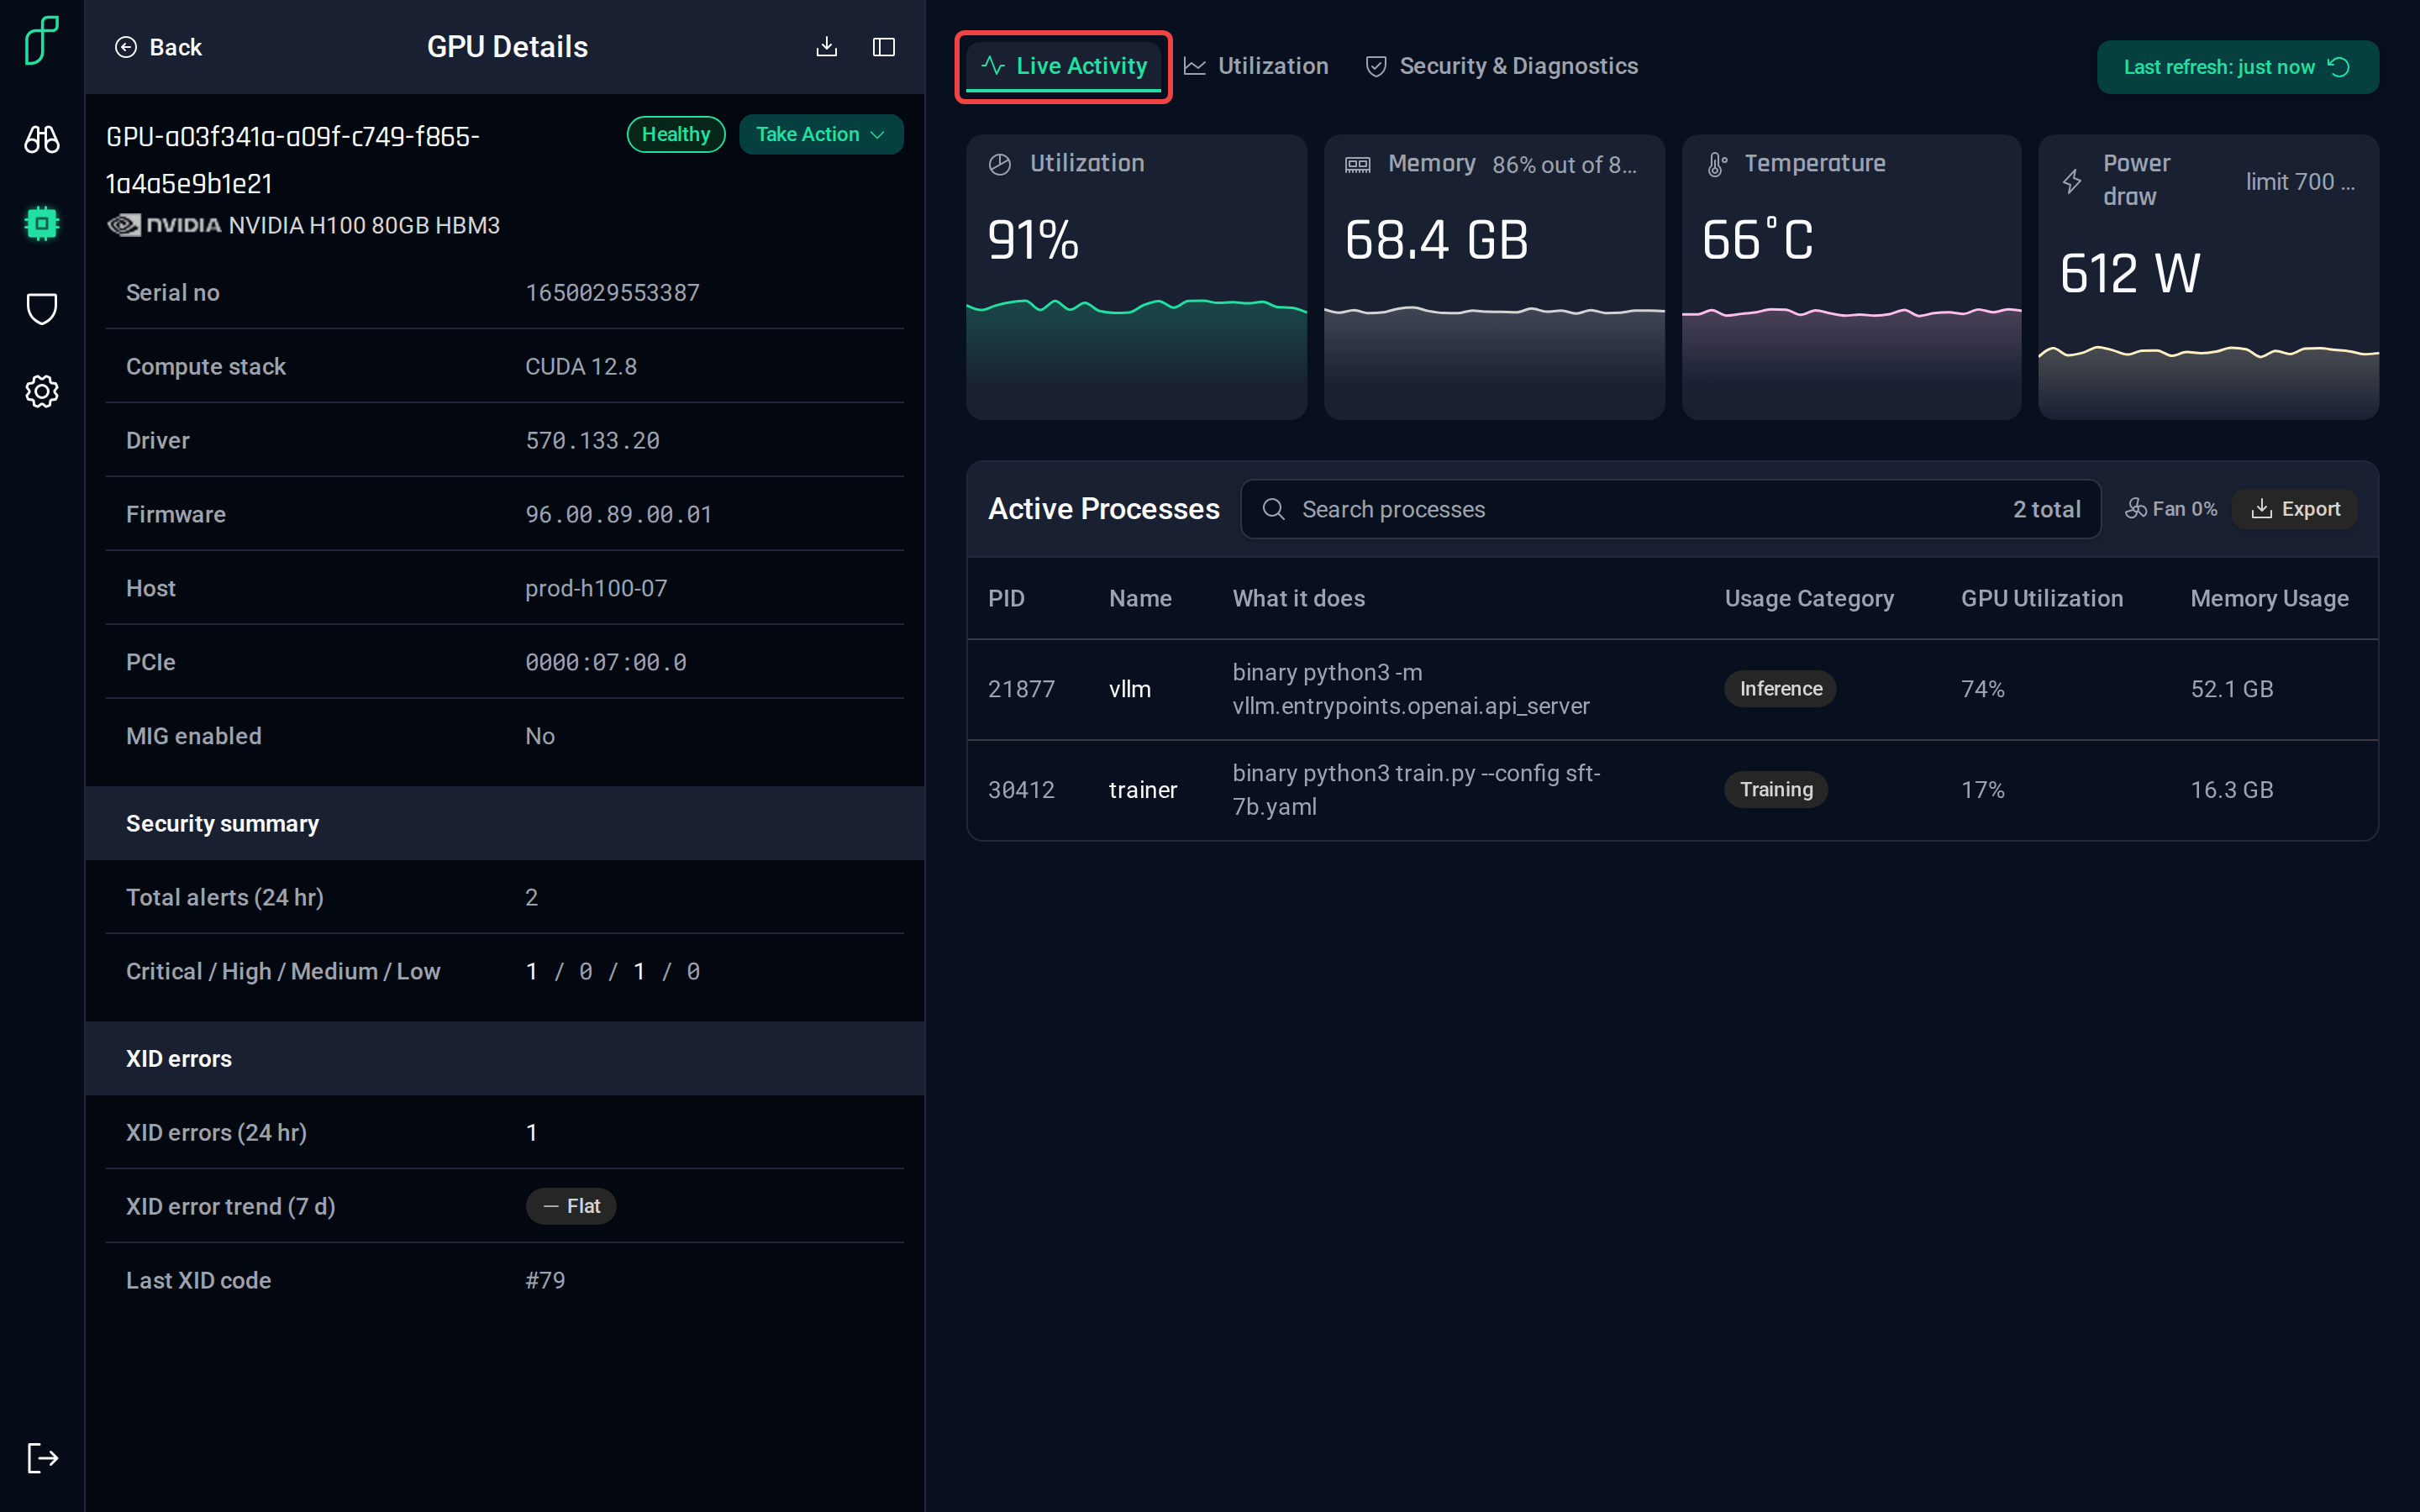
Utilization — busy, reserved and idle time, usage categories, and a recap per process family.
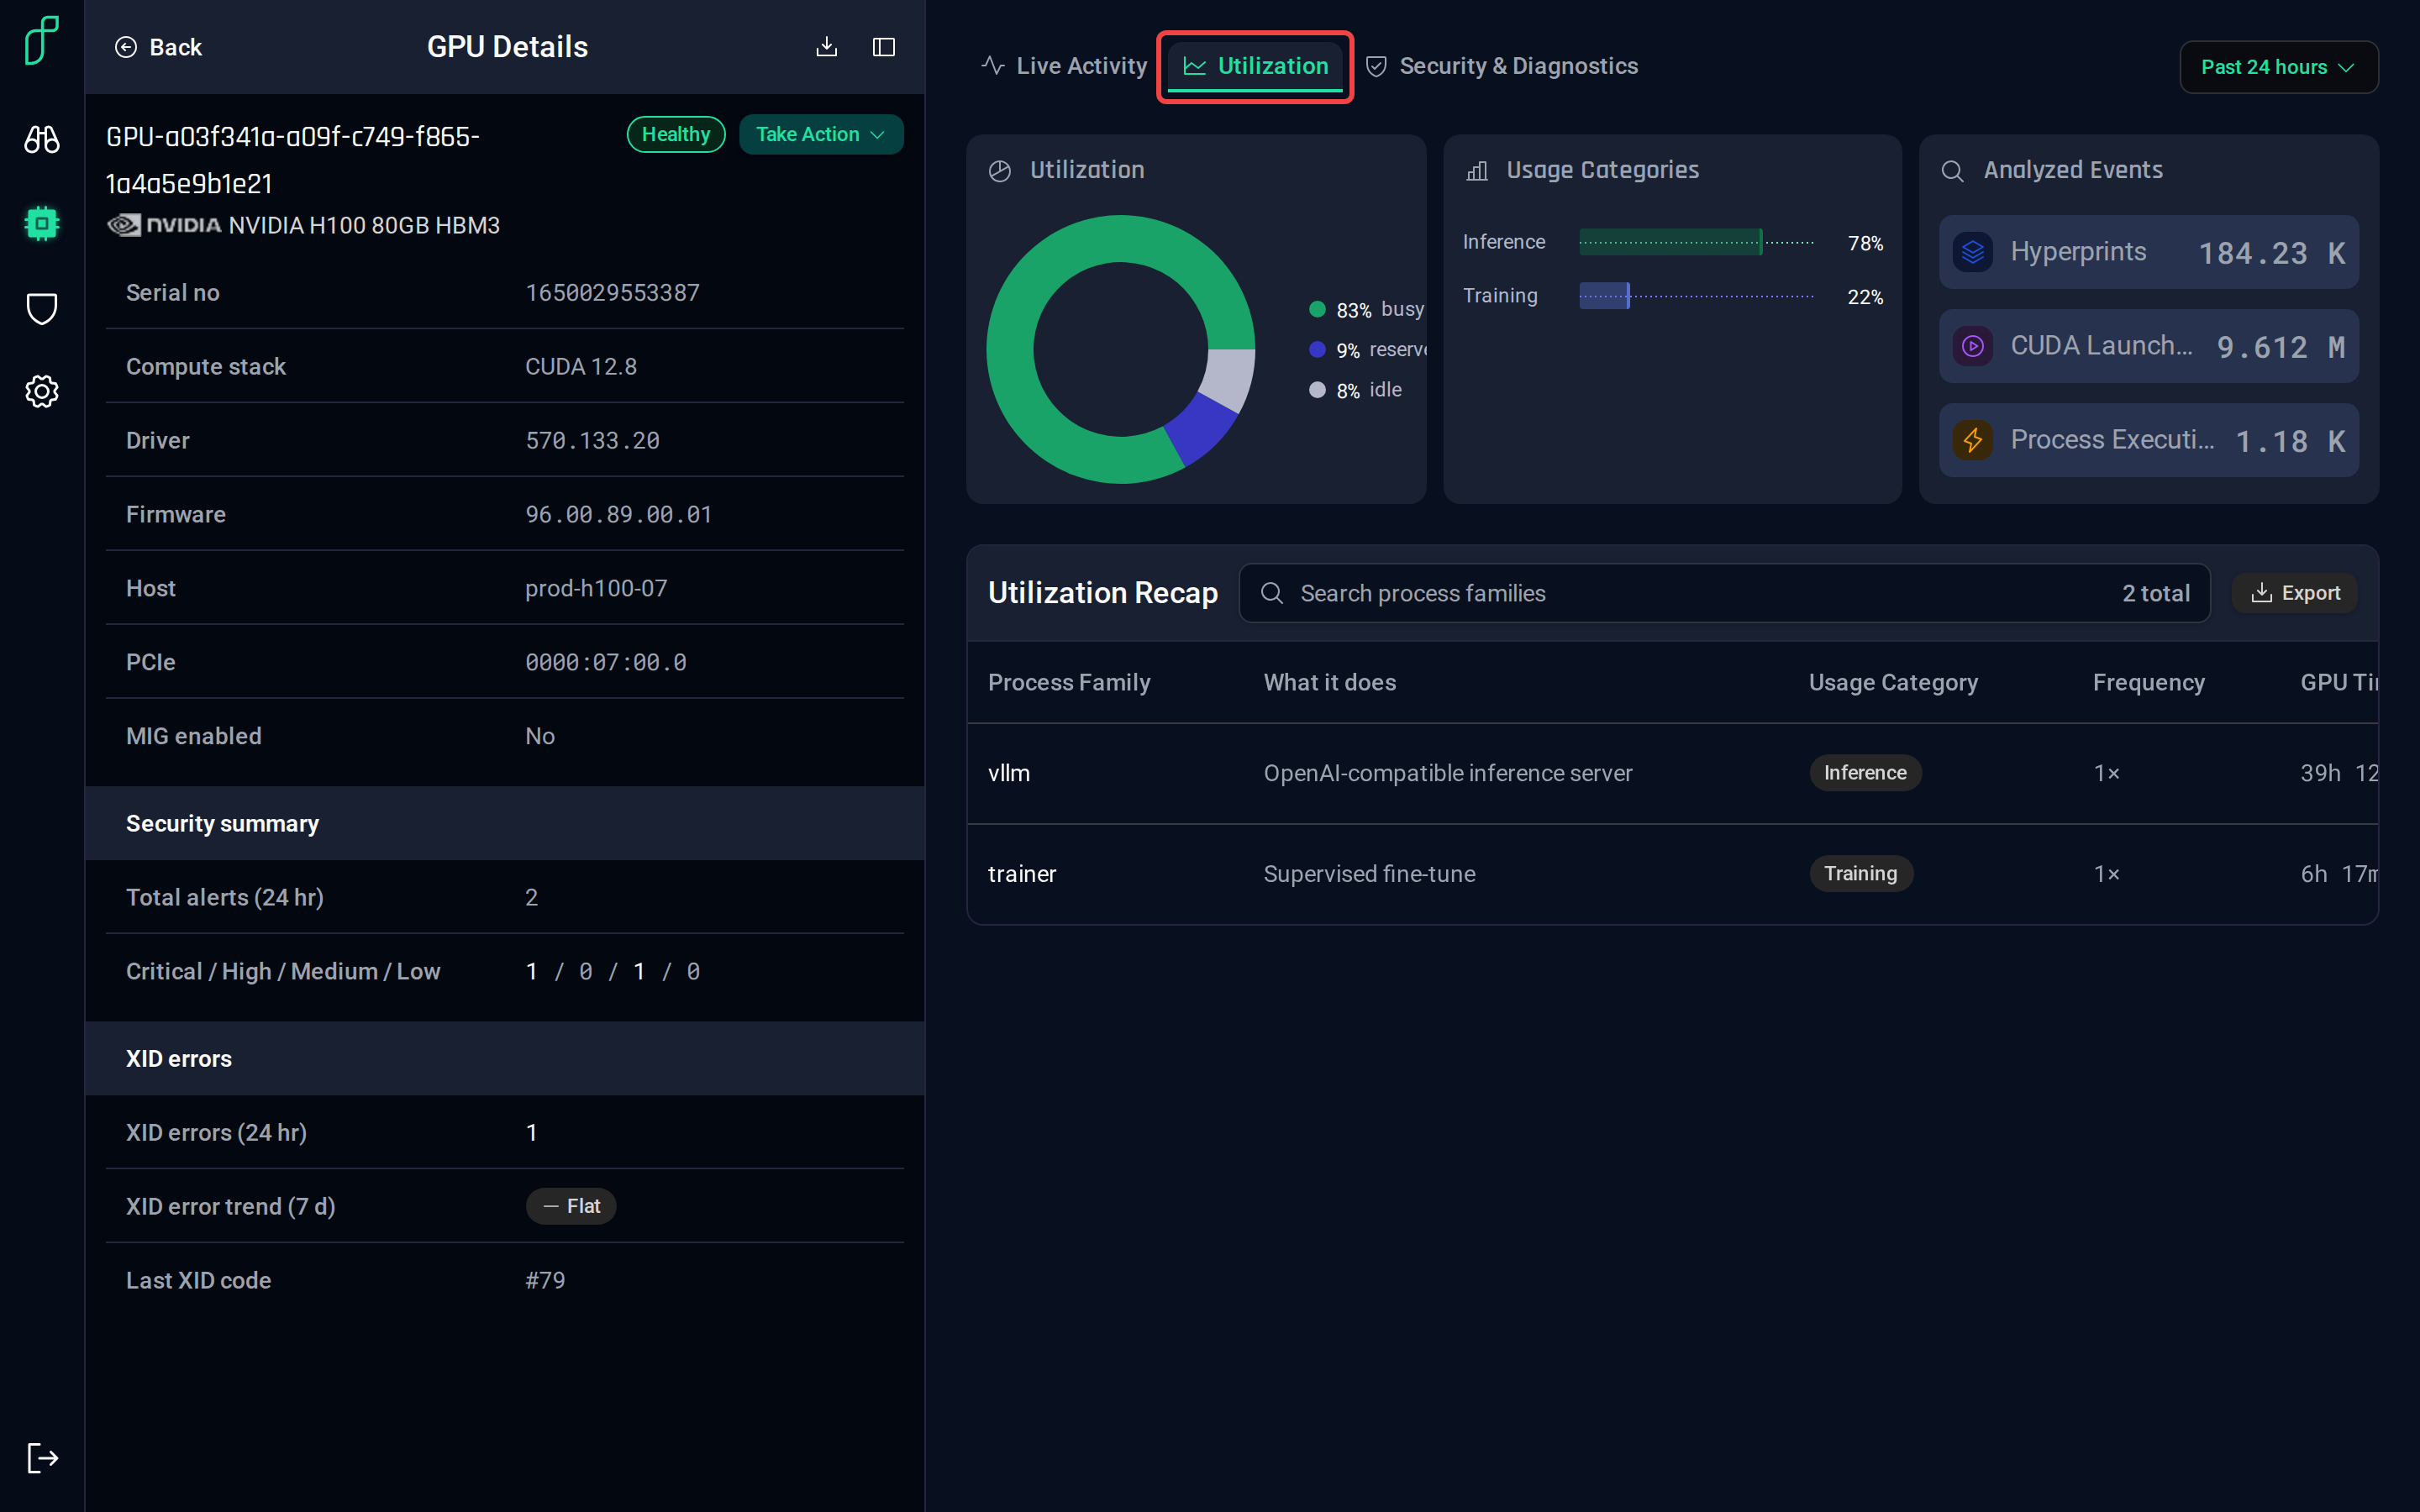
Security & Diagnostics — alerts on this GPU over the last day and week, and its recent XID errors.
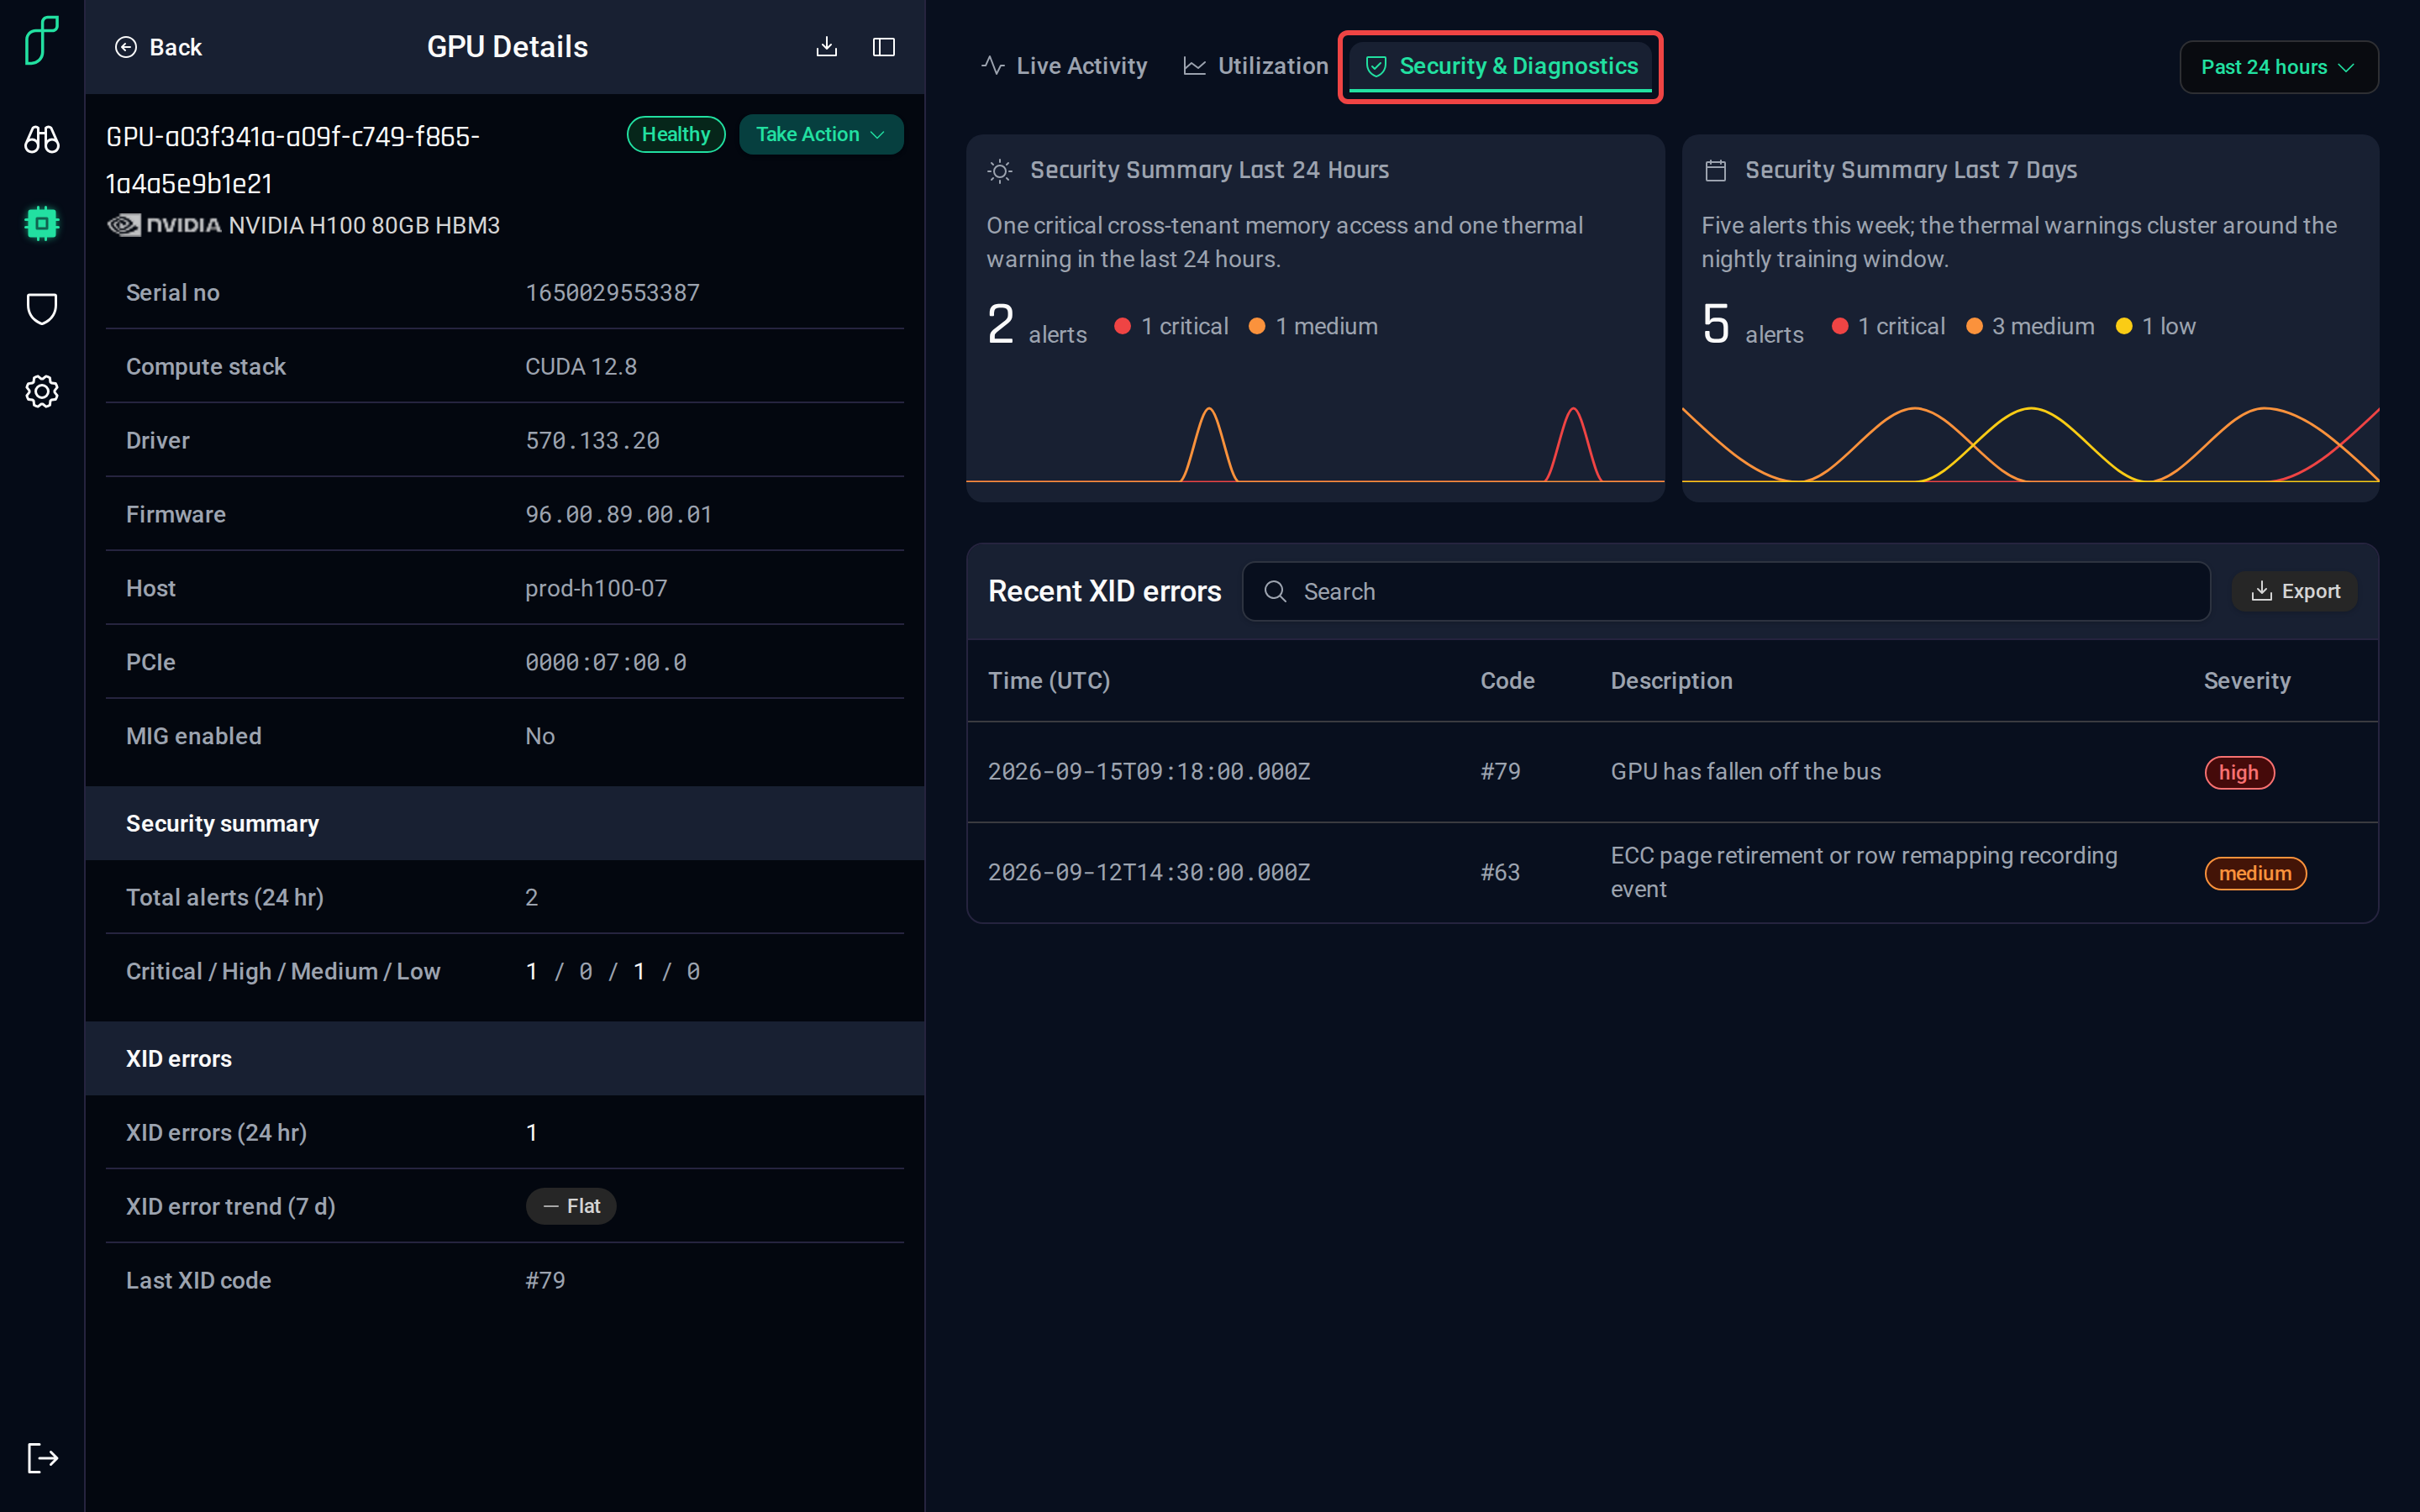
The utilization, temperature, power and XID figures on these tabs are the per-GPU series described under GPU metrics in the Metrics Reference.
Taking action
Take Action sends a command to the agent on the GPU's host. Isolating a GPU keeps new work off it; resetting it clears a wedged device.
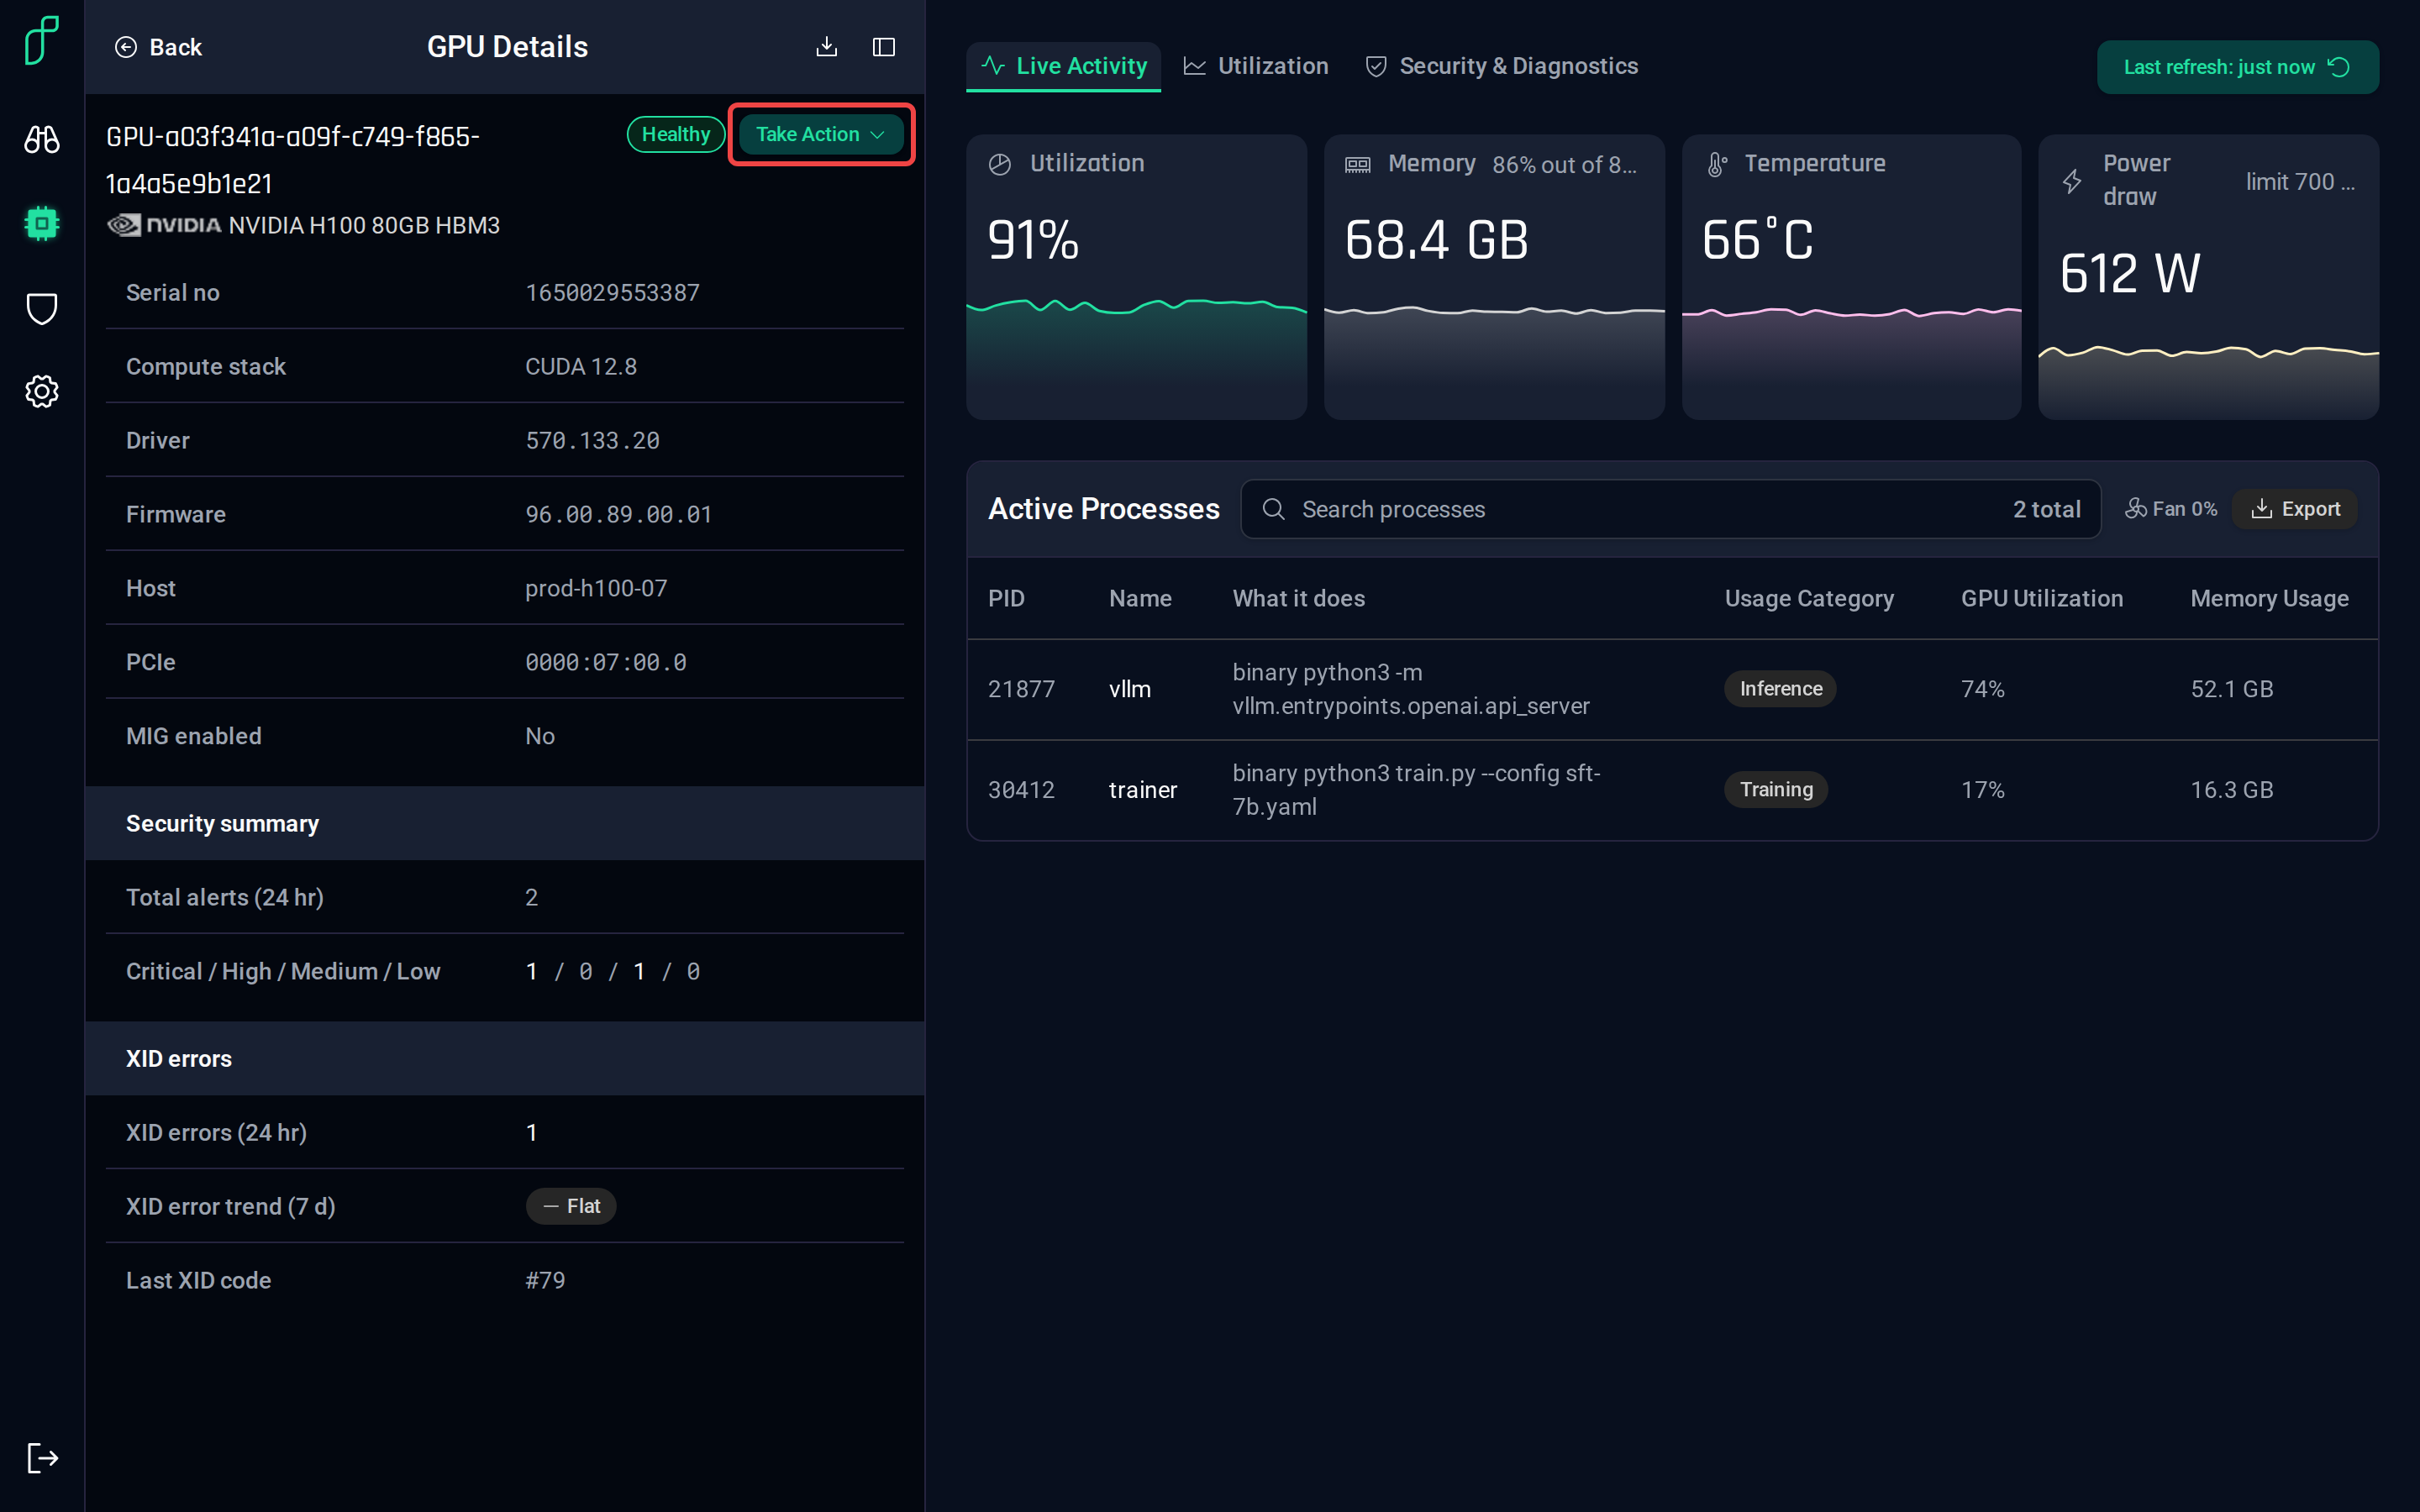
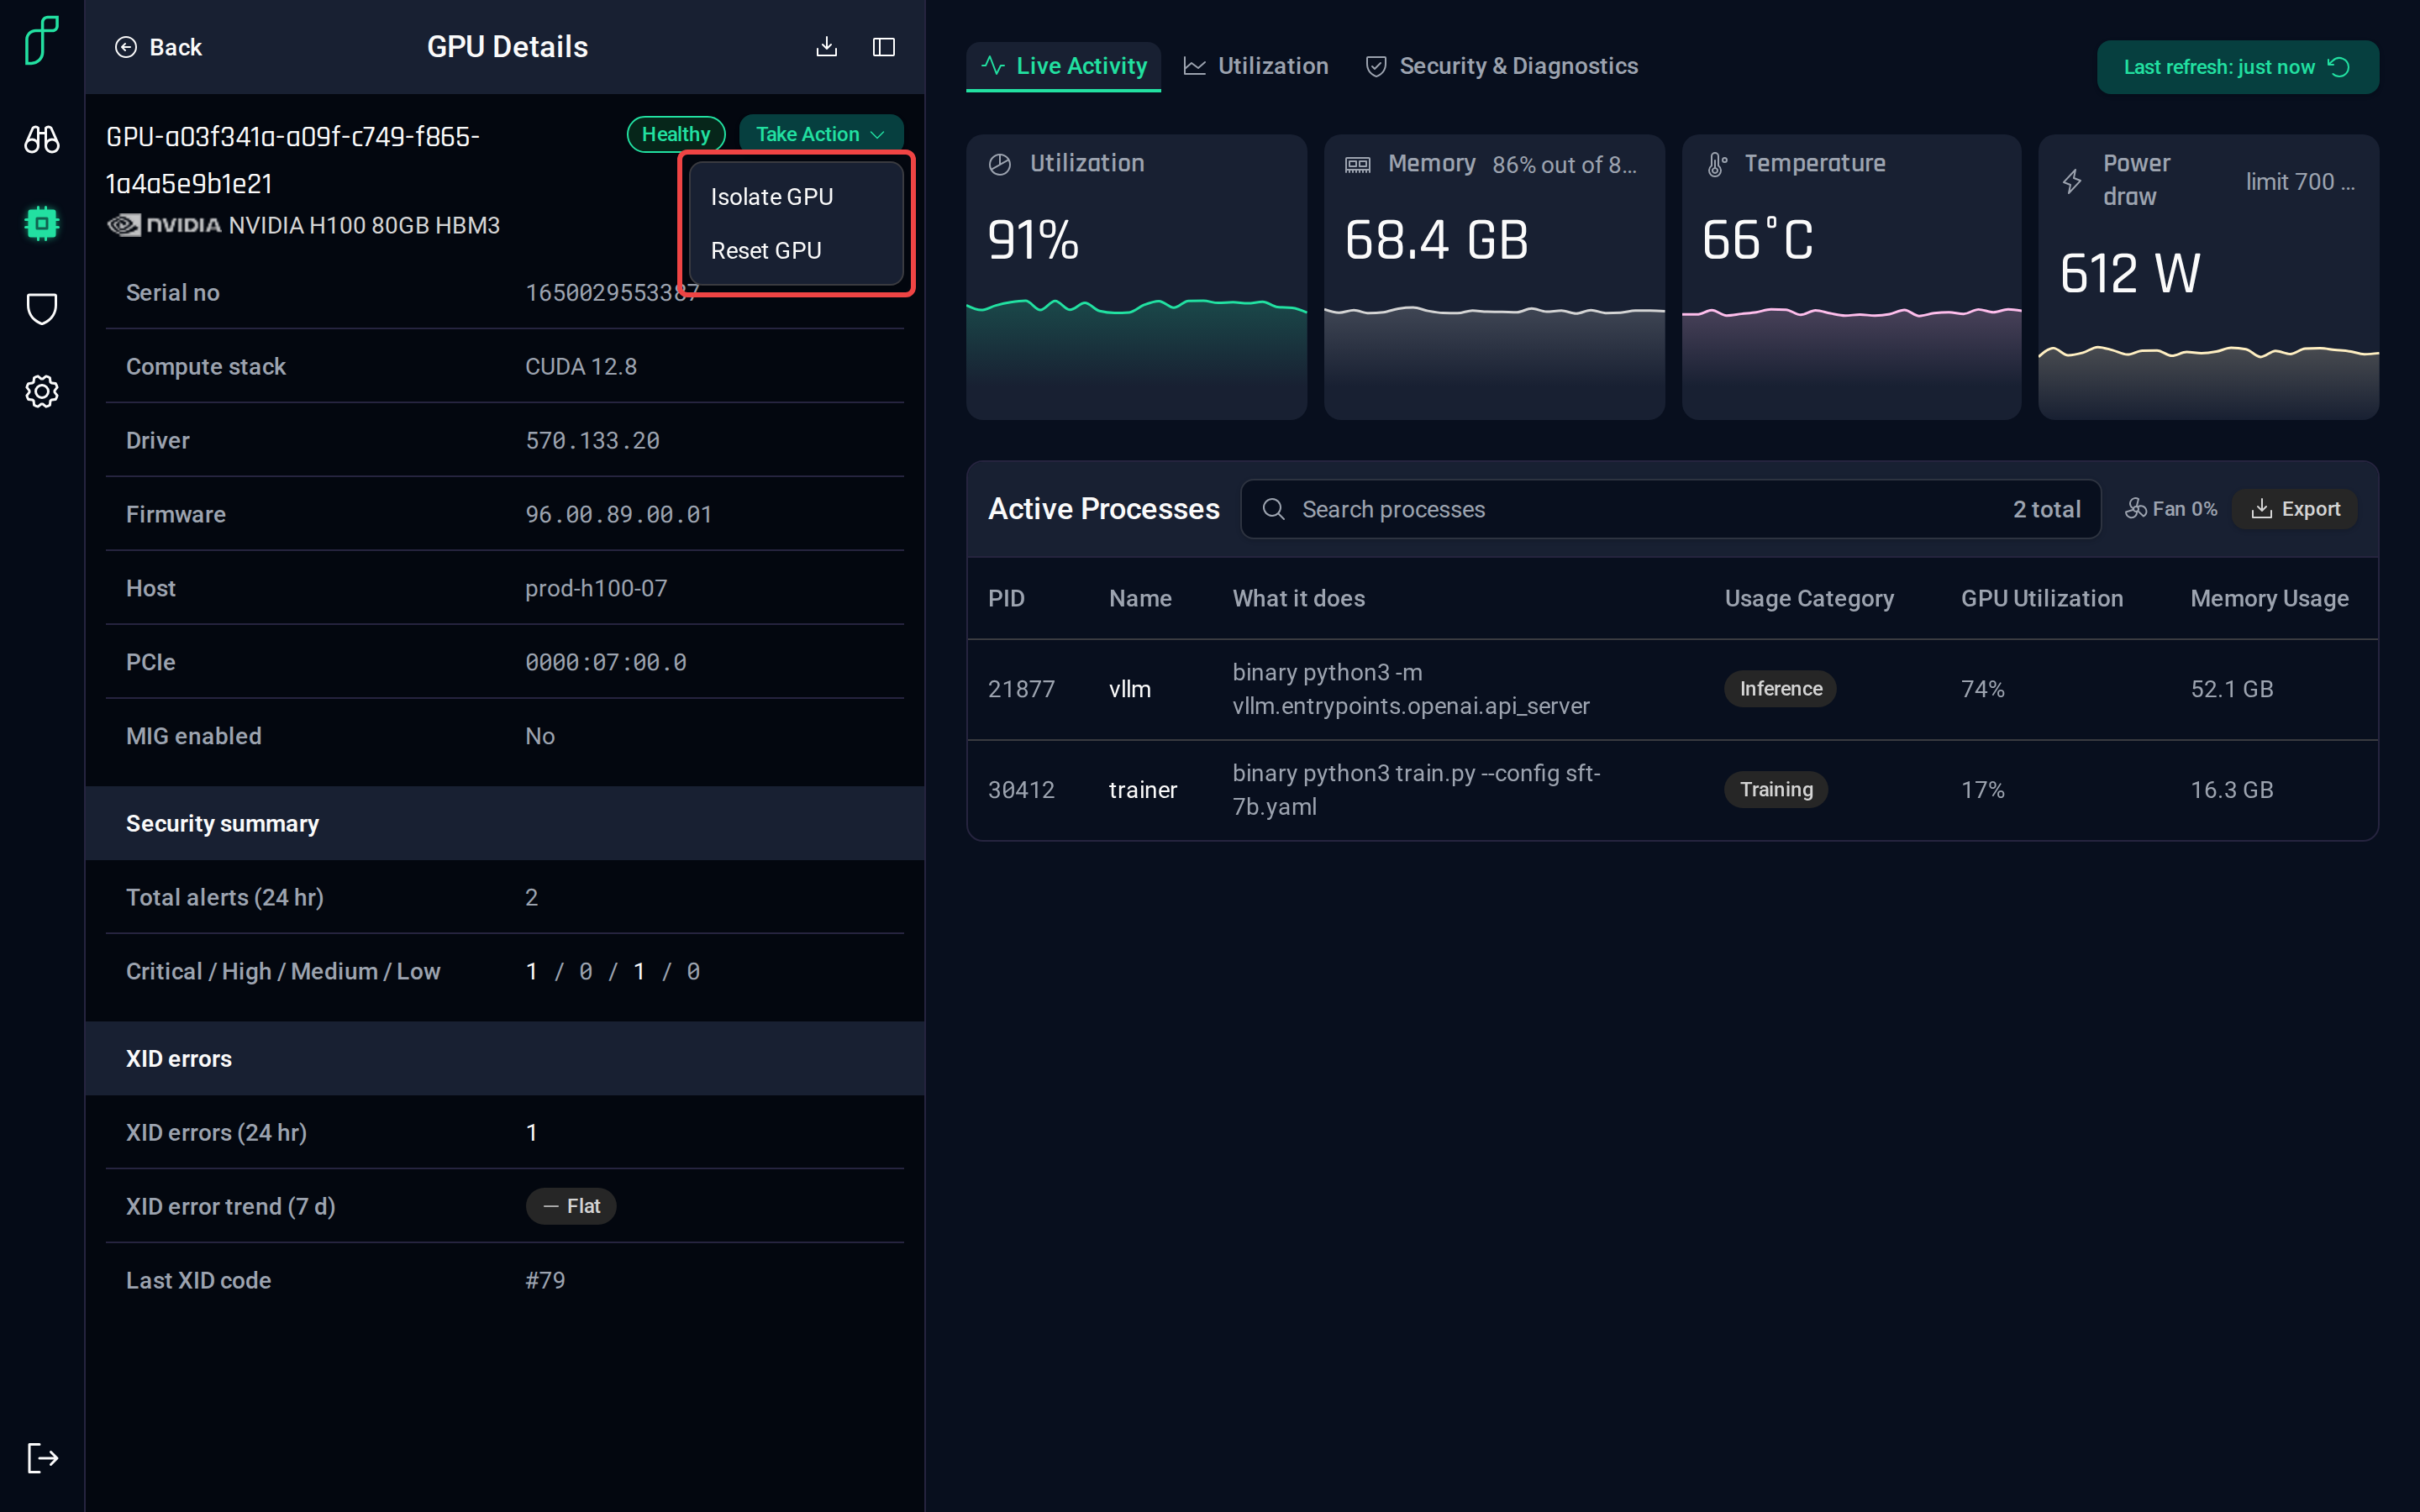
Every action asks for confirmation before it runs.
Going deeper
- The GPUs as JSON:
GET /gpuslists them, and the details endpoints return what the tabs show. The unhealthy GPUs recipe is a good start. - Ask an assistant which GPUs are unhealthy or what a GPU is running; the MCP Tools cover the same list and details.
- Each GPU is reported by the agent on its host; Setting up the Agent covers getting one onto every node.