Security Alerts
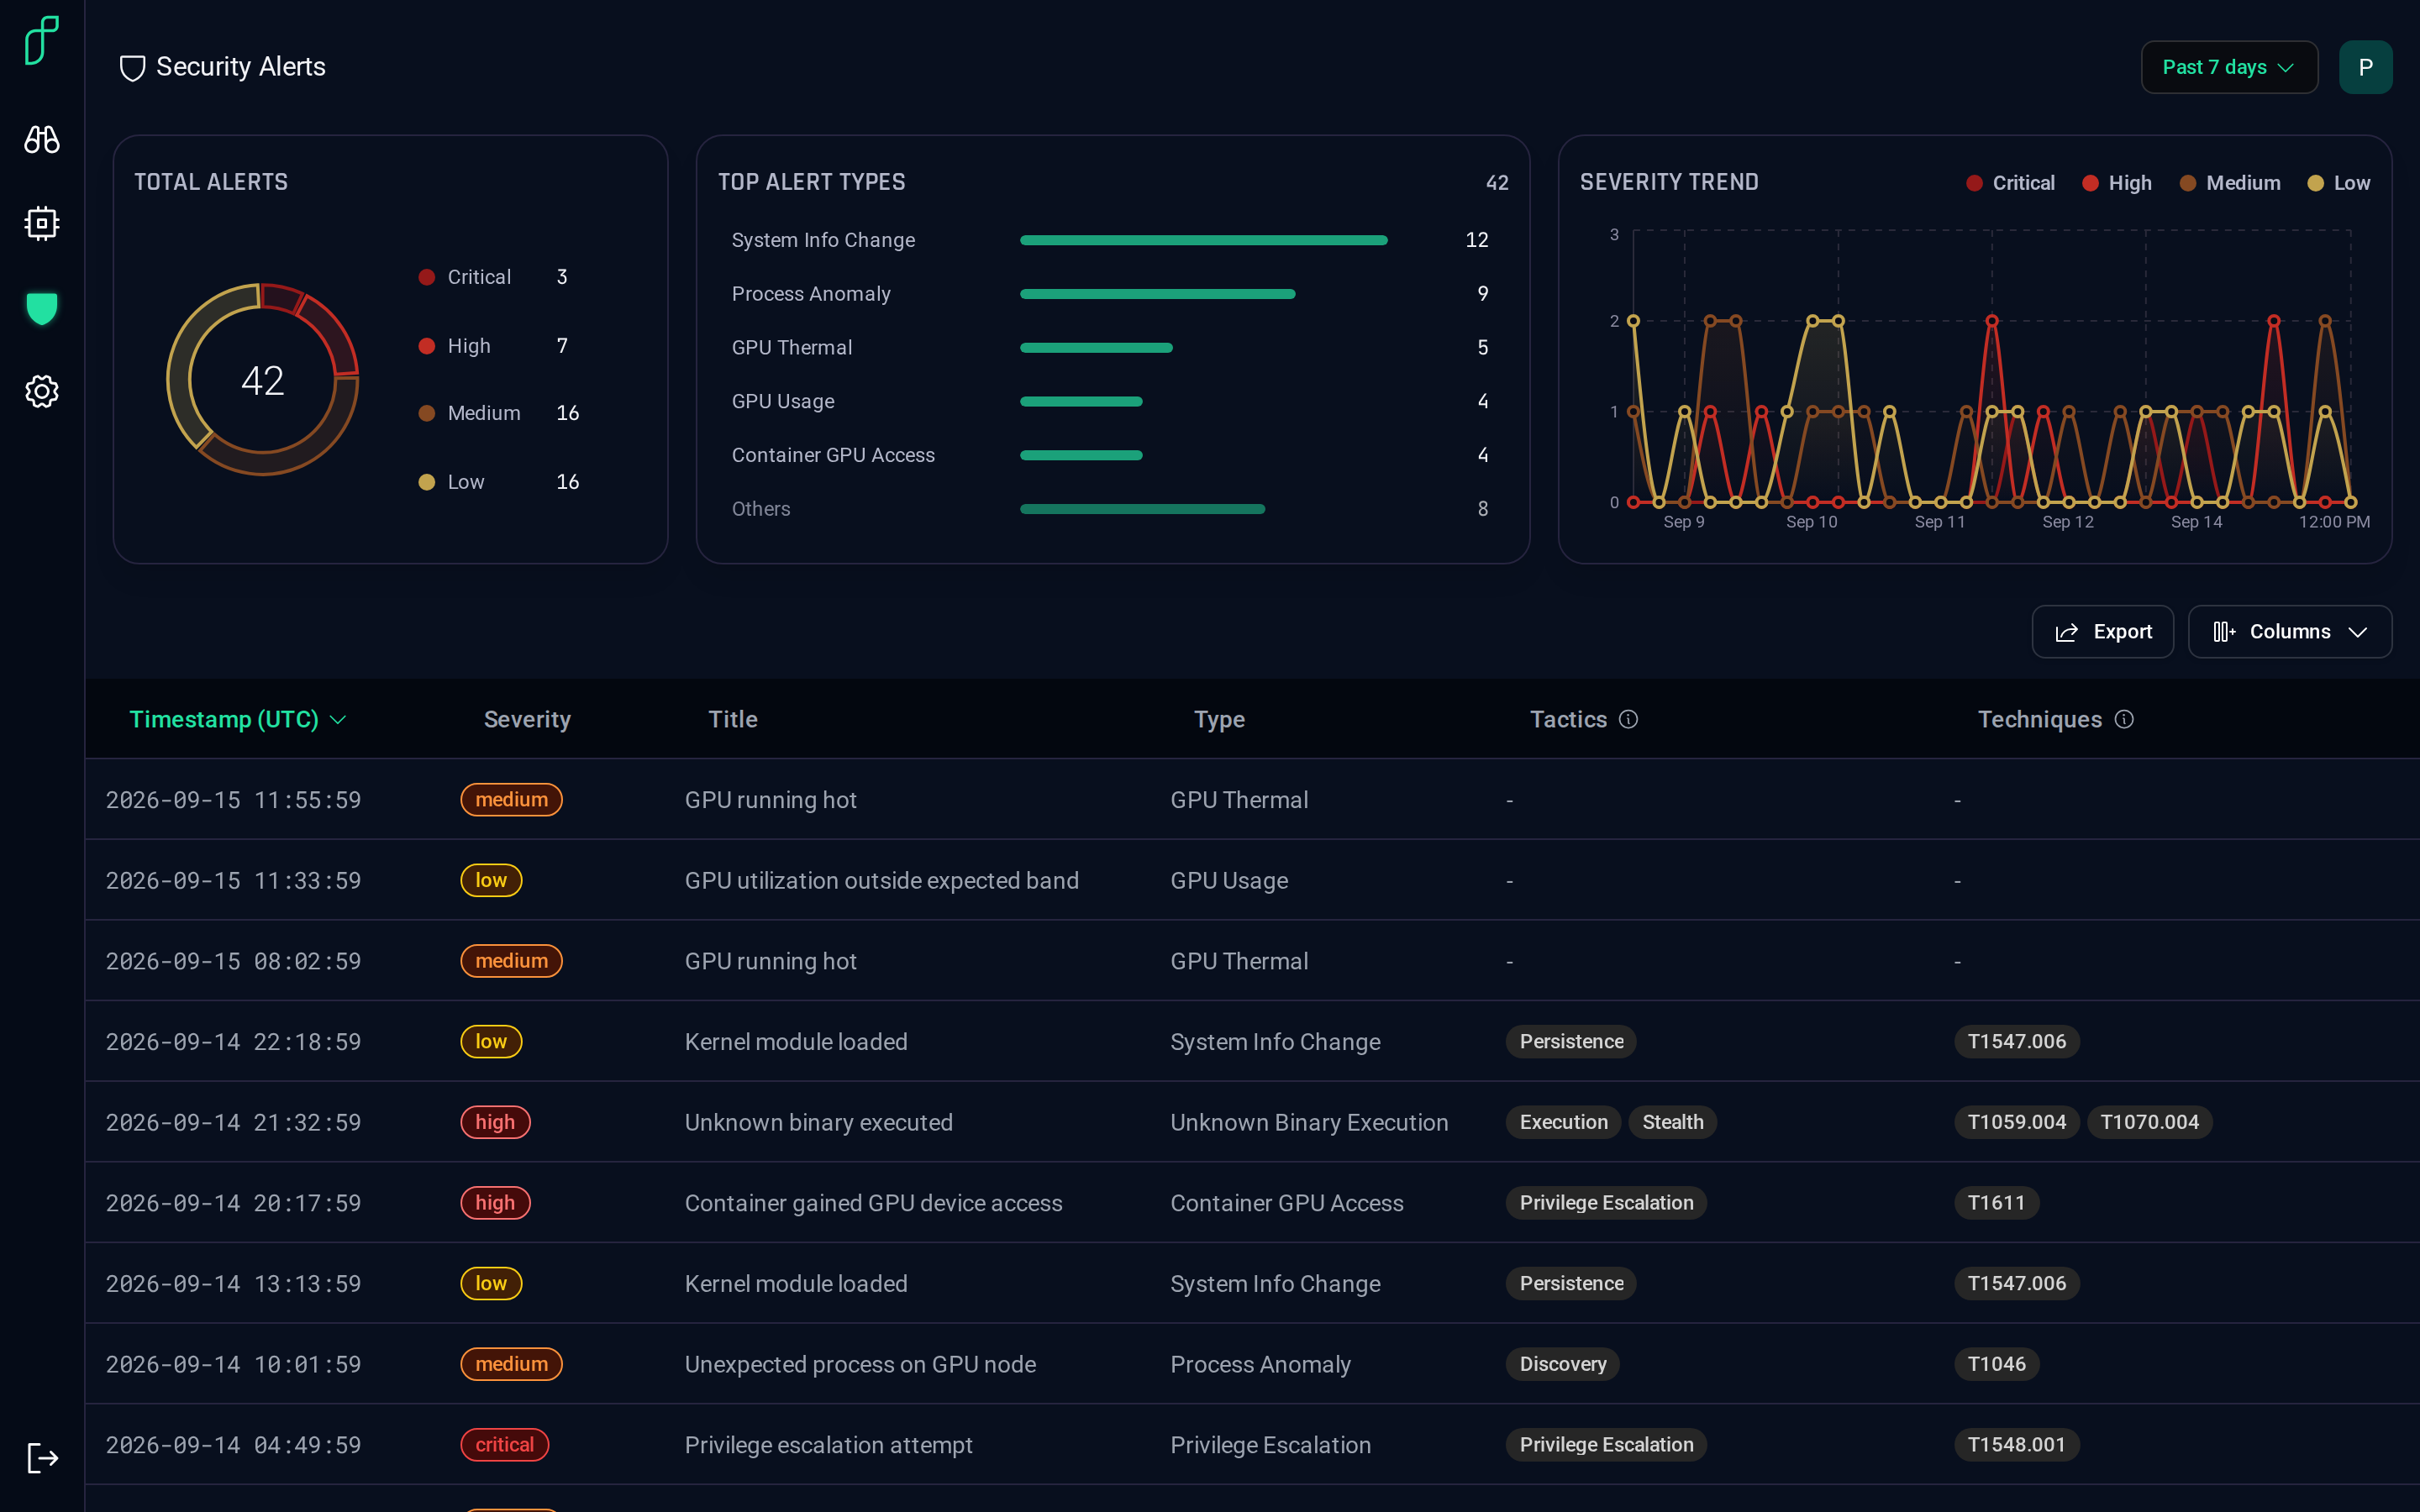
Security Alerts lists what the detectors raised in the workspace over the time range: the totals by severity, the top alert types, the severity trend, and the alerts themselves.
Narrowing the list
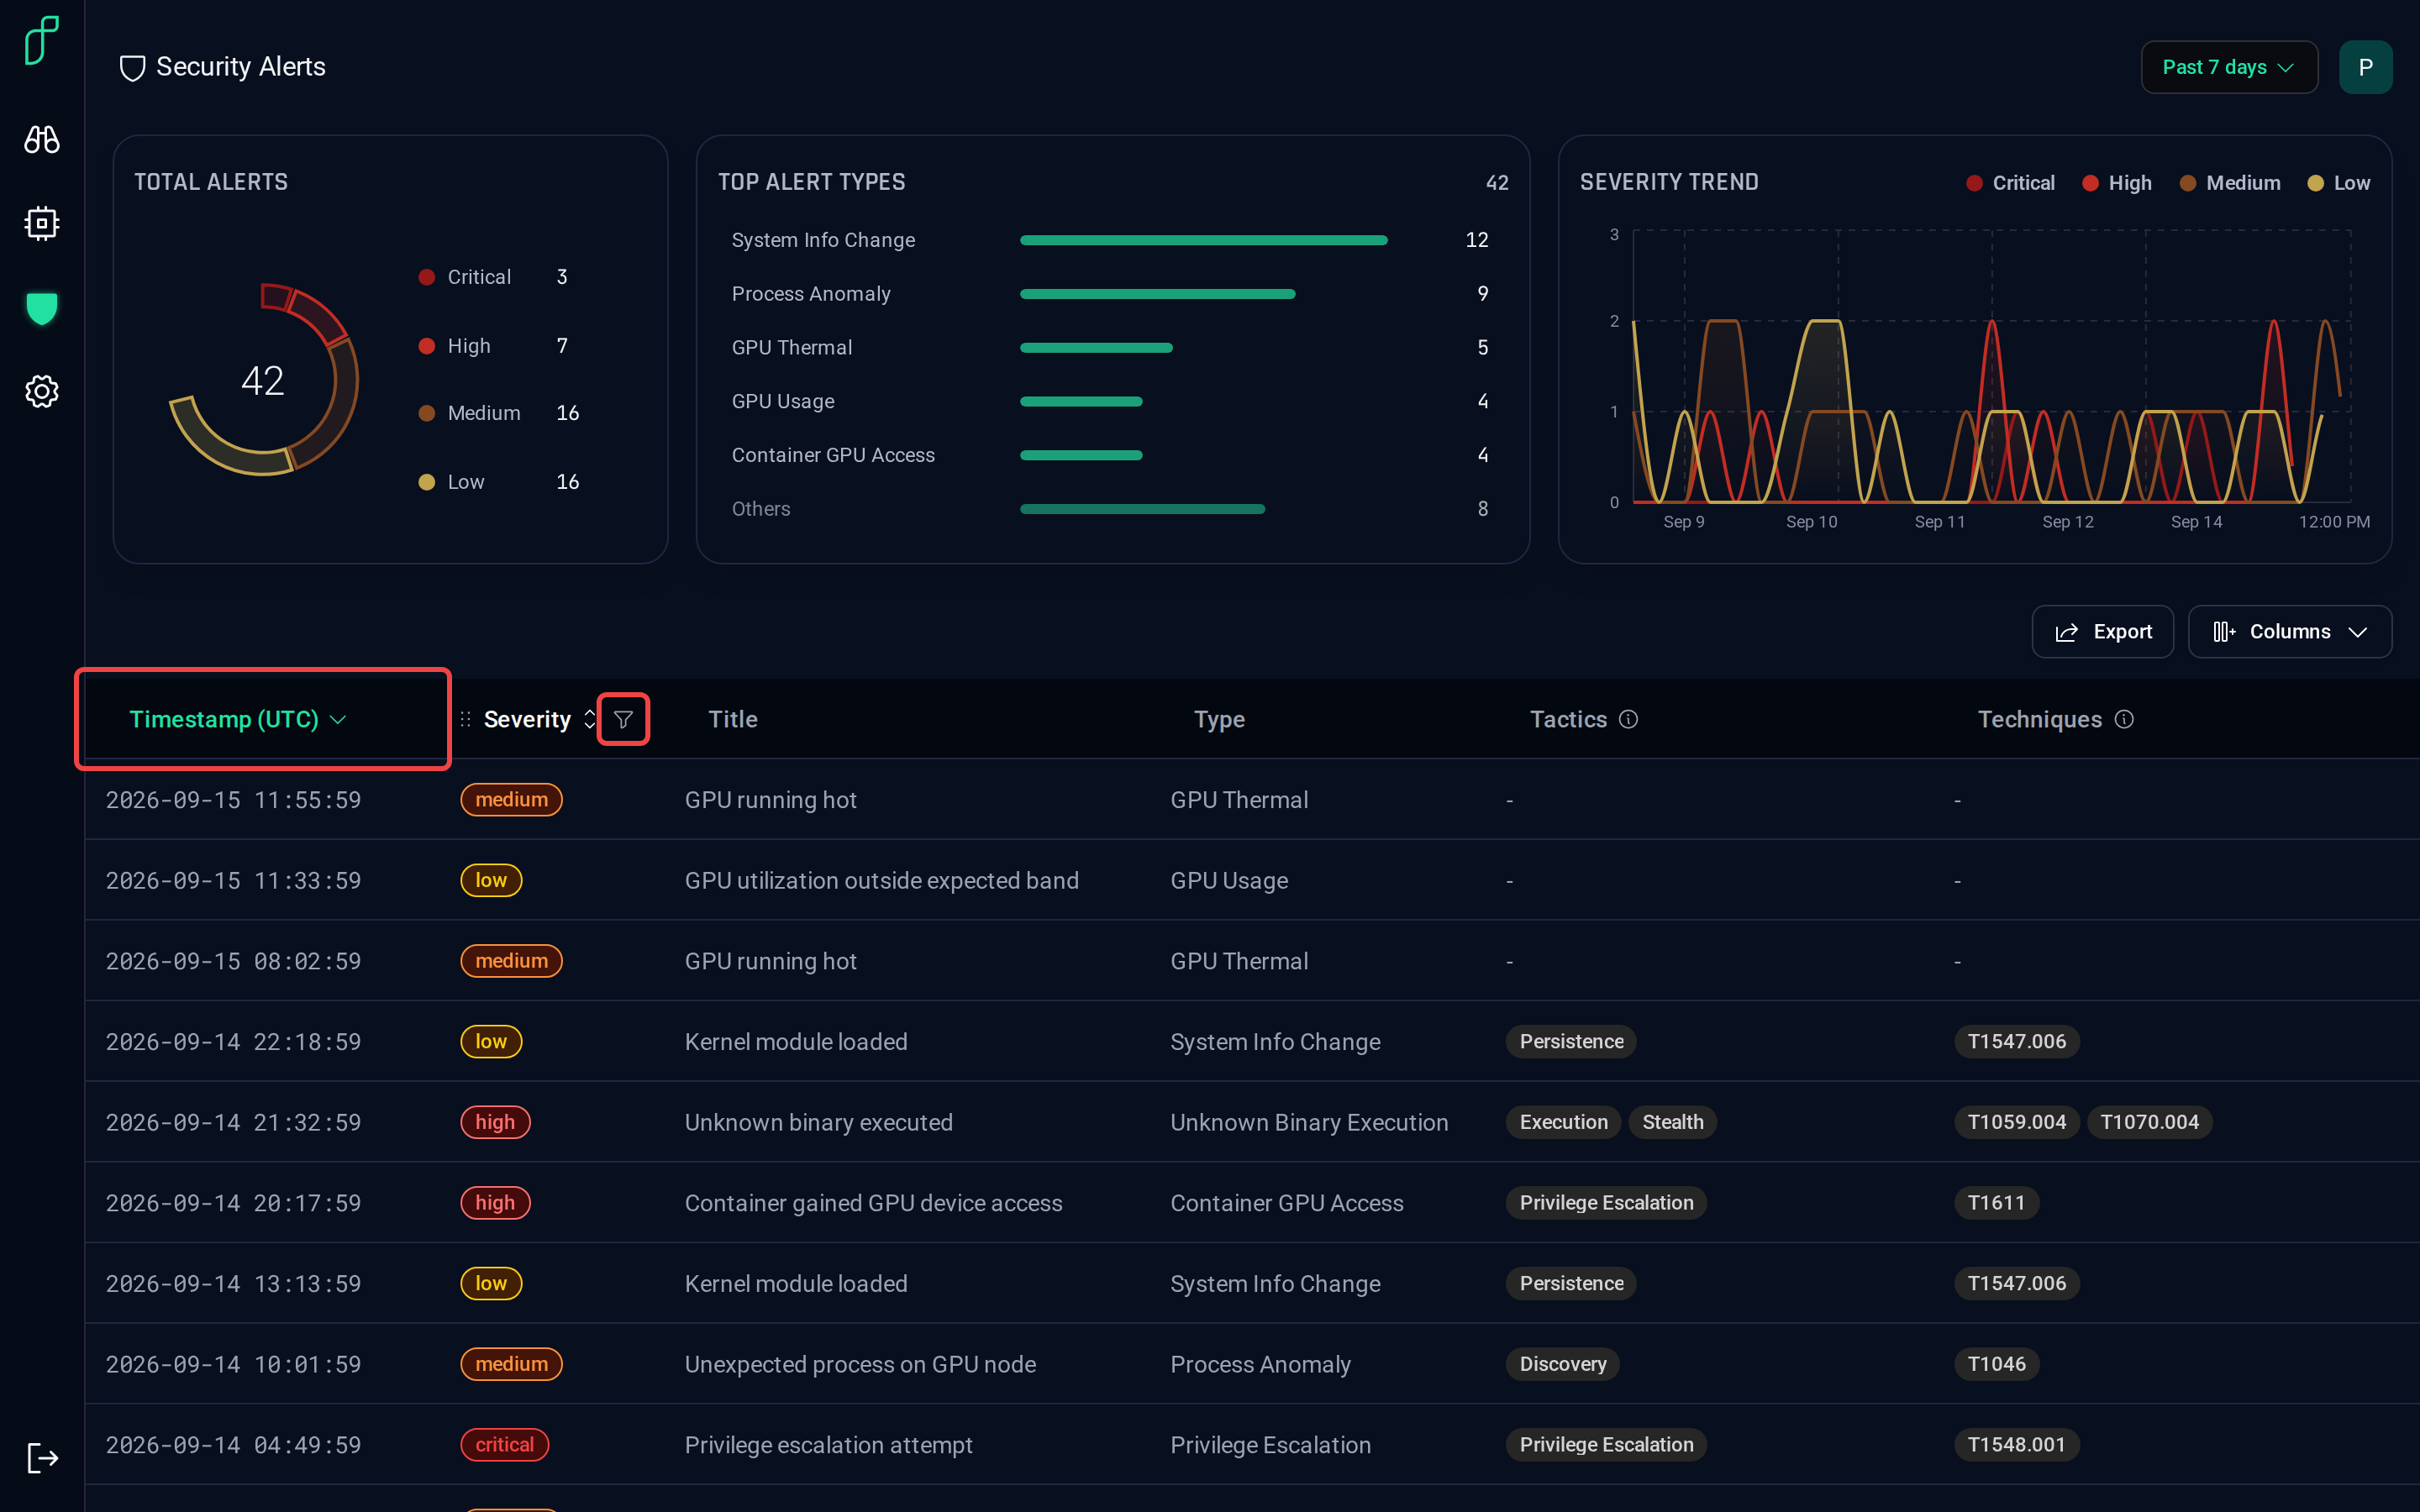
Hover a column header for its filter; the timestamp header sorts. Filters apply to the cards at the top as well as the table.
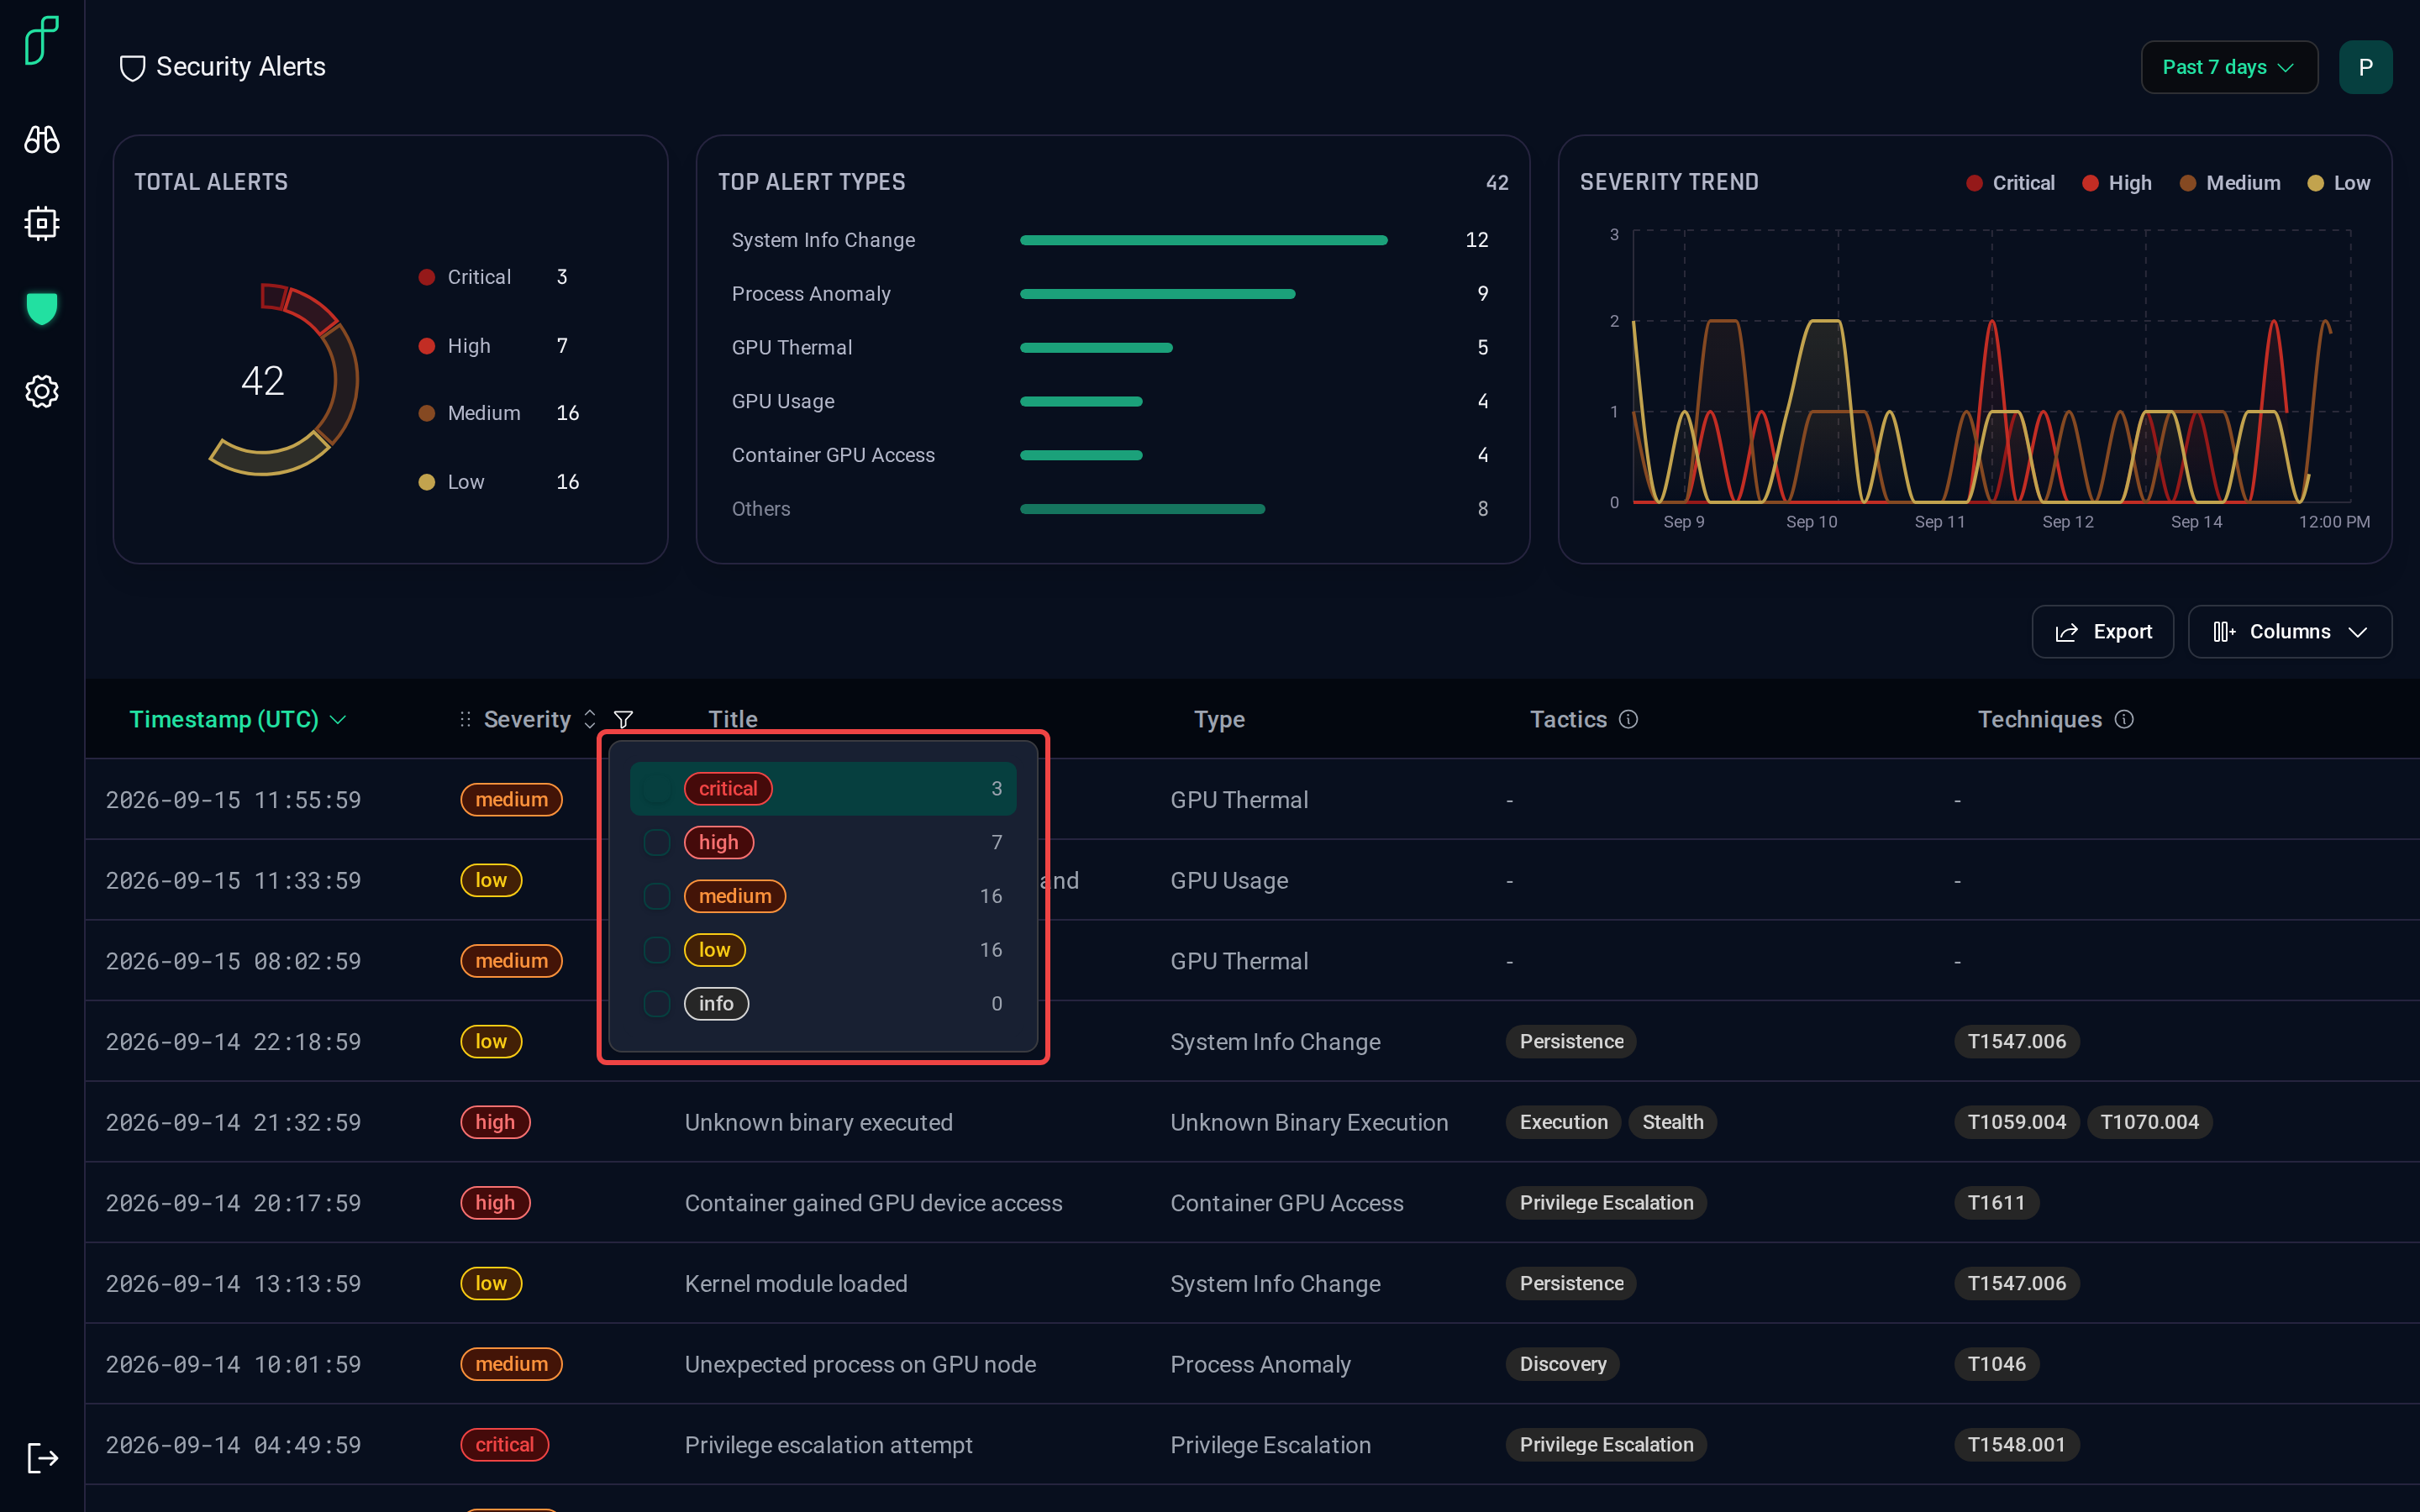
The Alert Types Reference explains every type in the Type column, and what each severity means.
Opening an alert
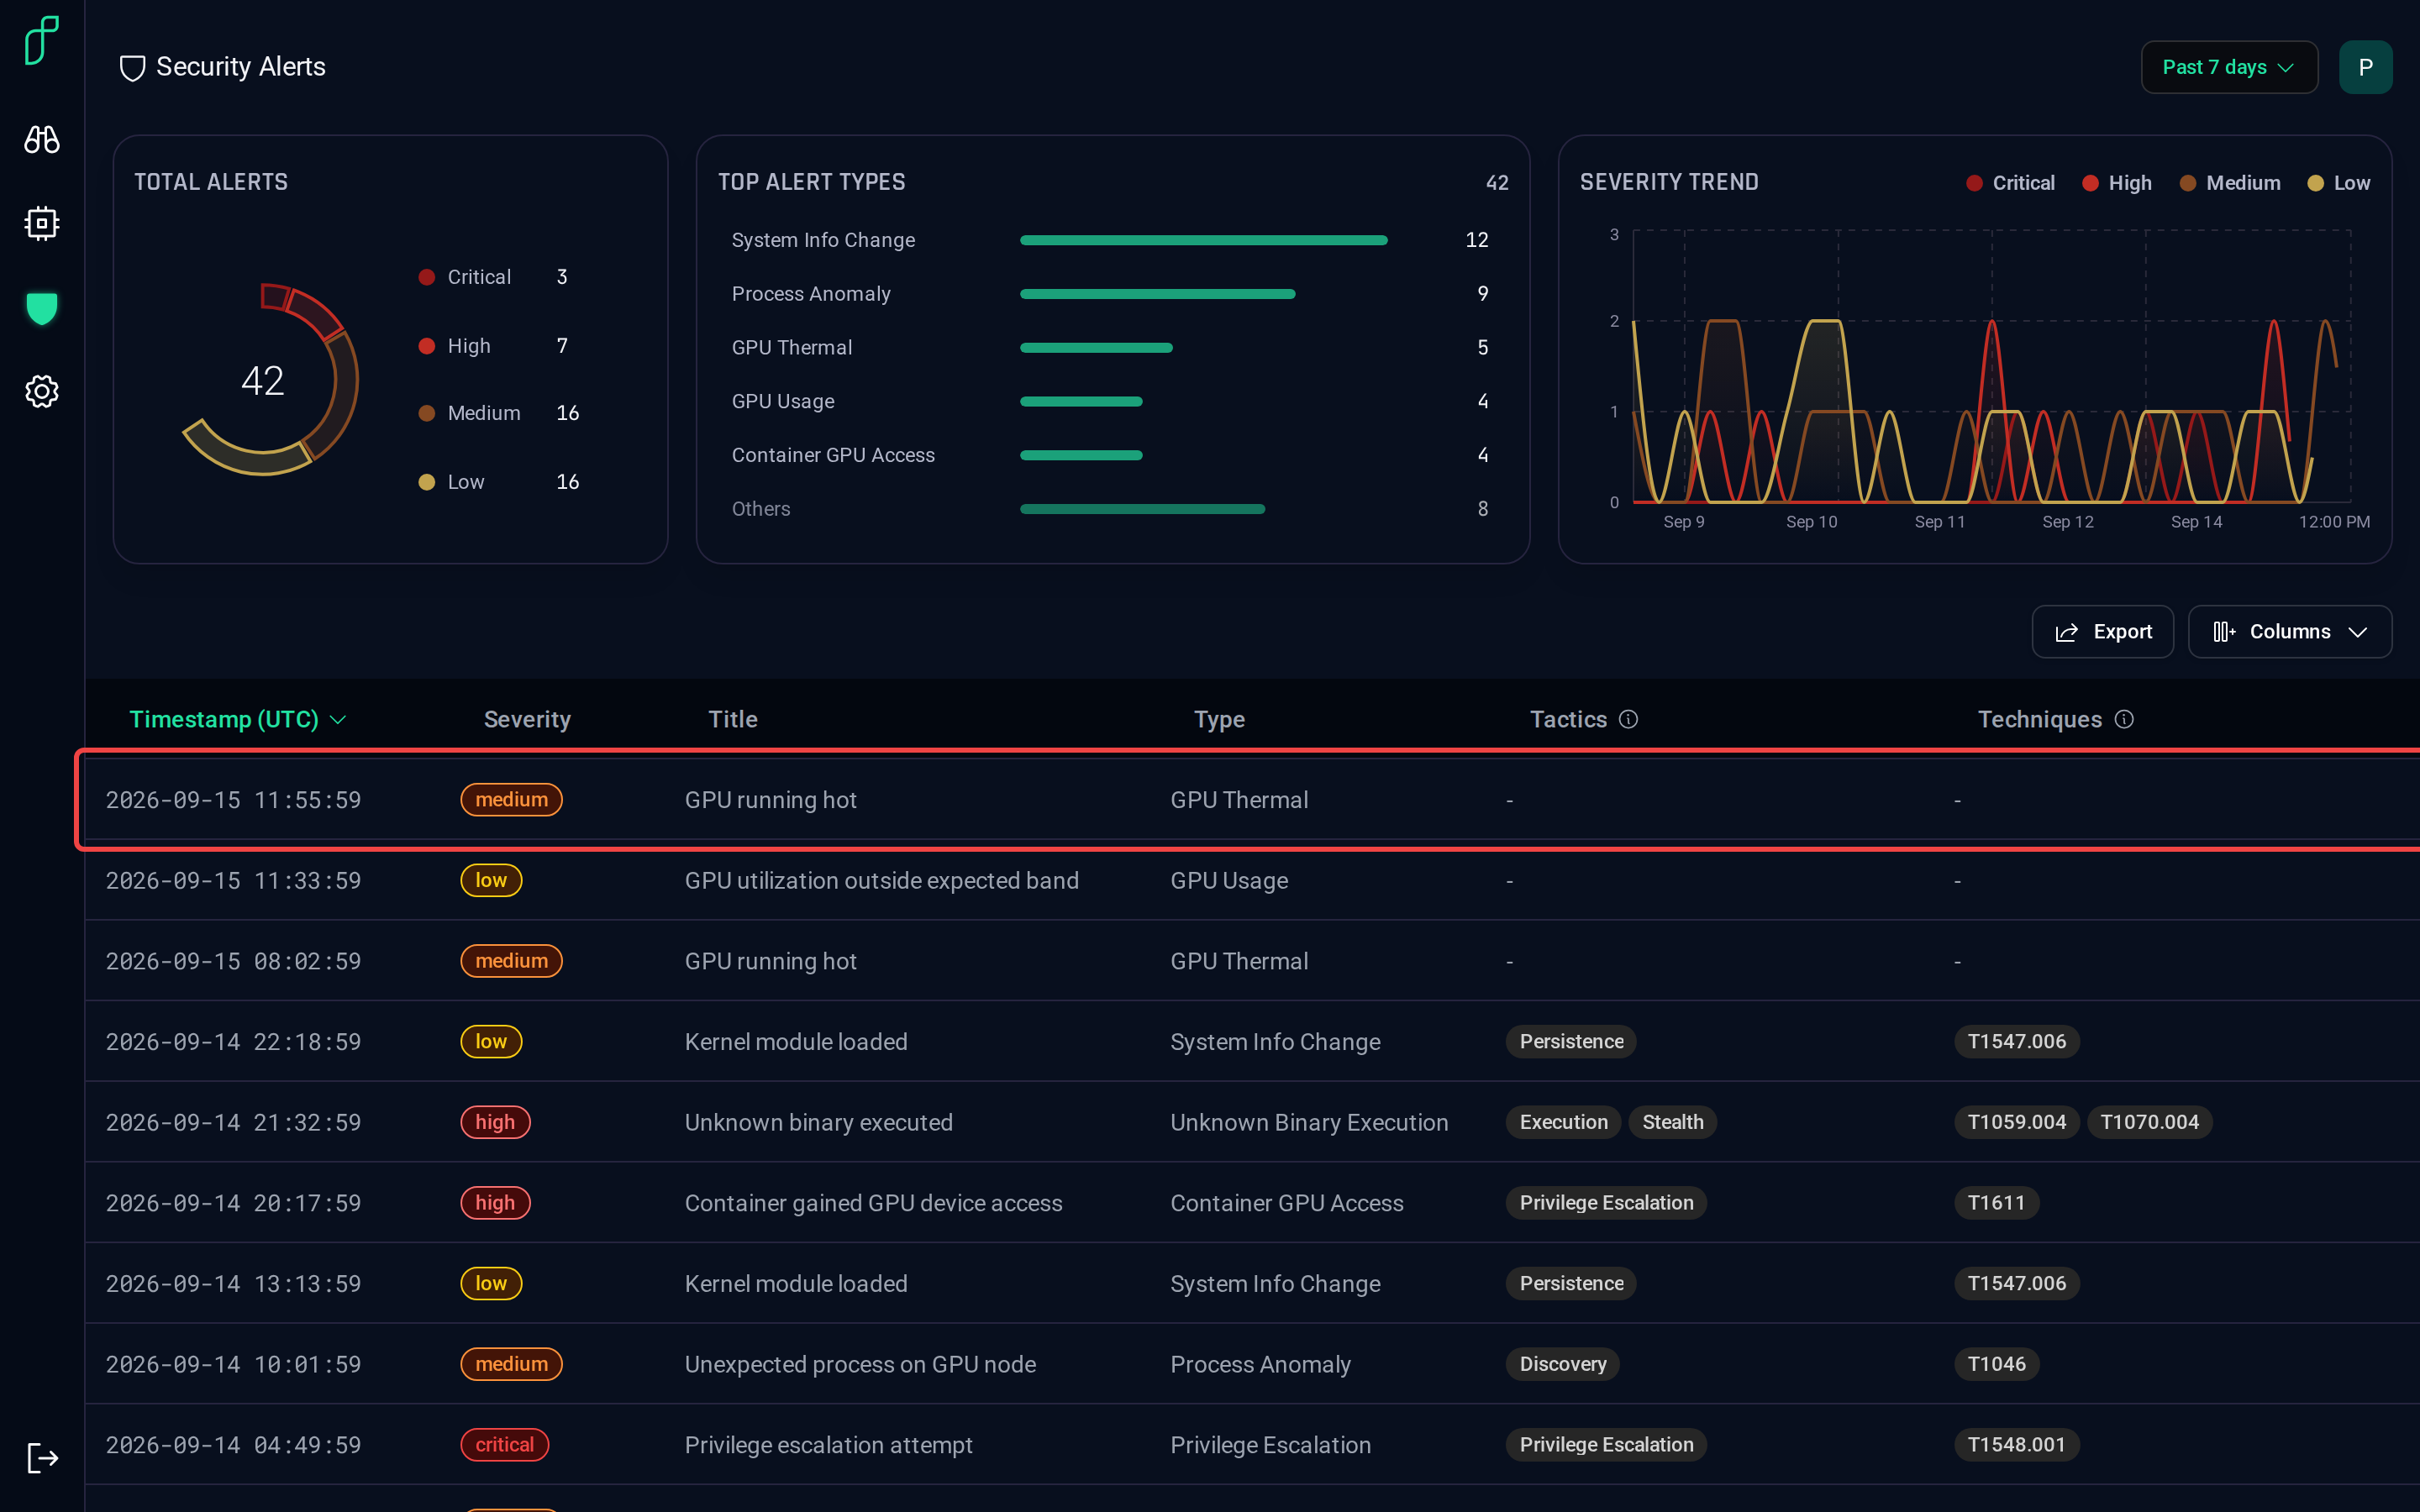
Click a row to open the alert.
Alert details
The side panel identifies the alert: severity, when and where it was detected, the GPU involved, and its MITRE ATT&CK® mapping. The tabs beside it tell the story.
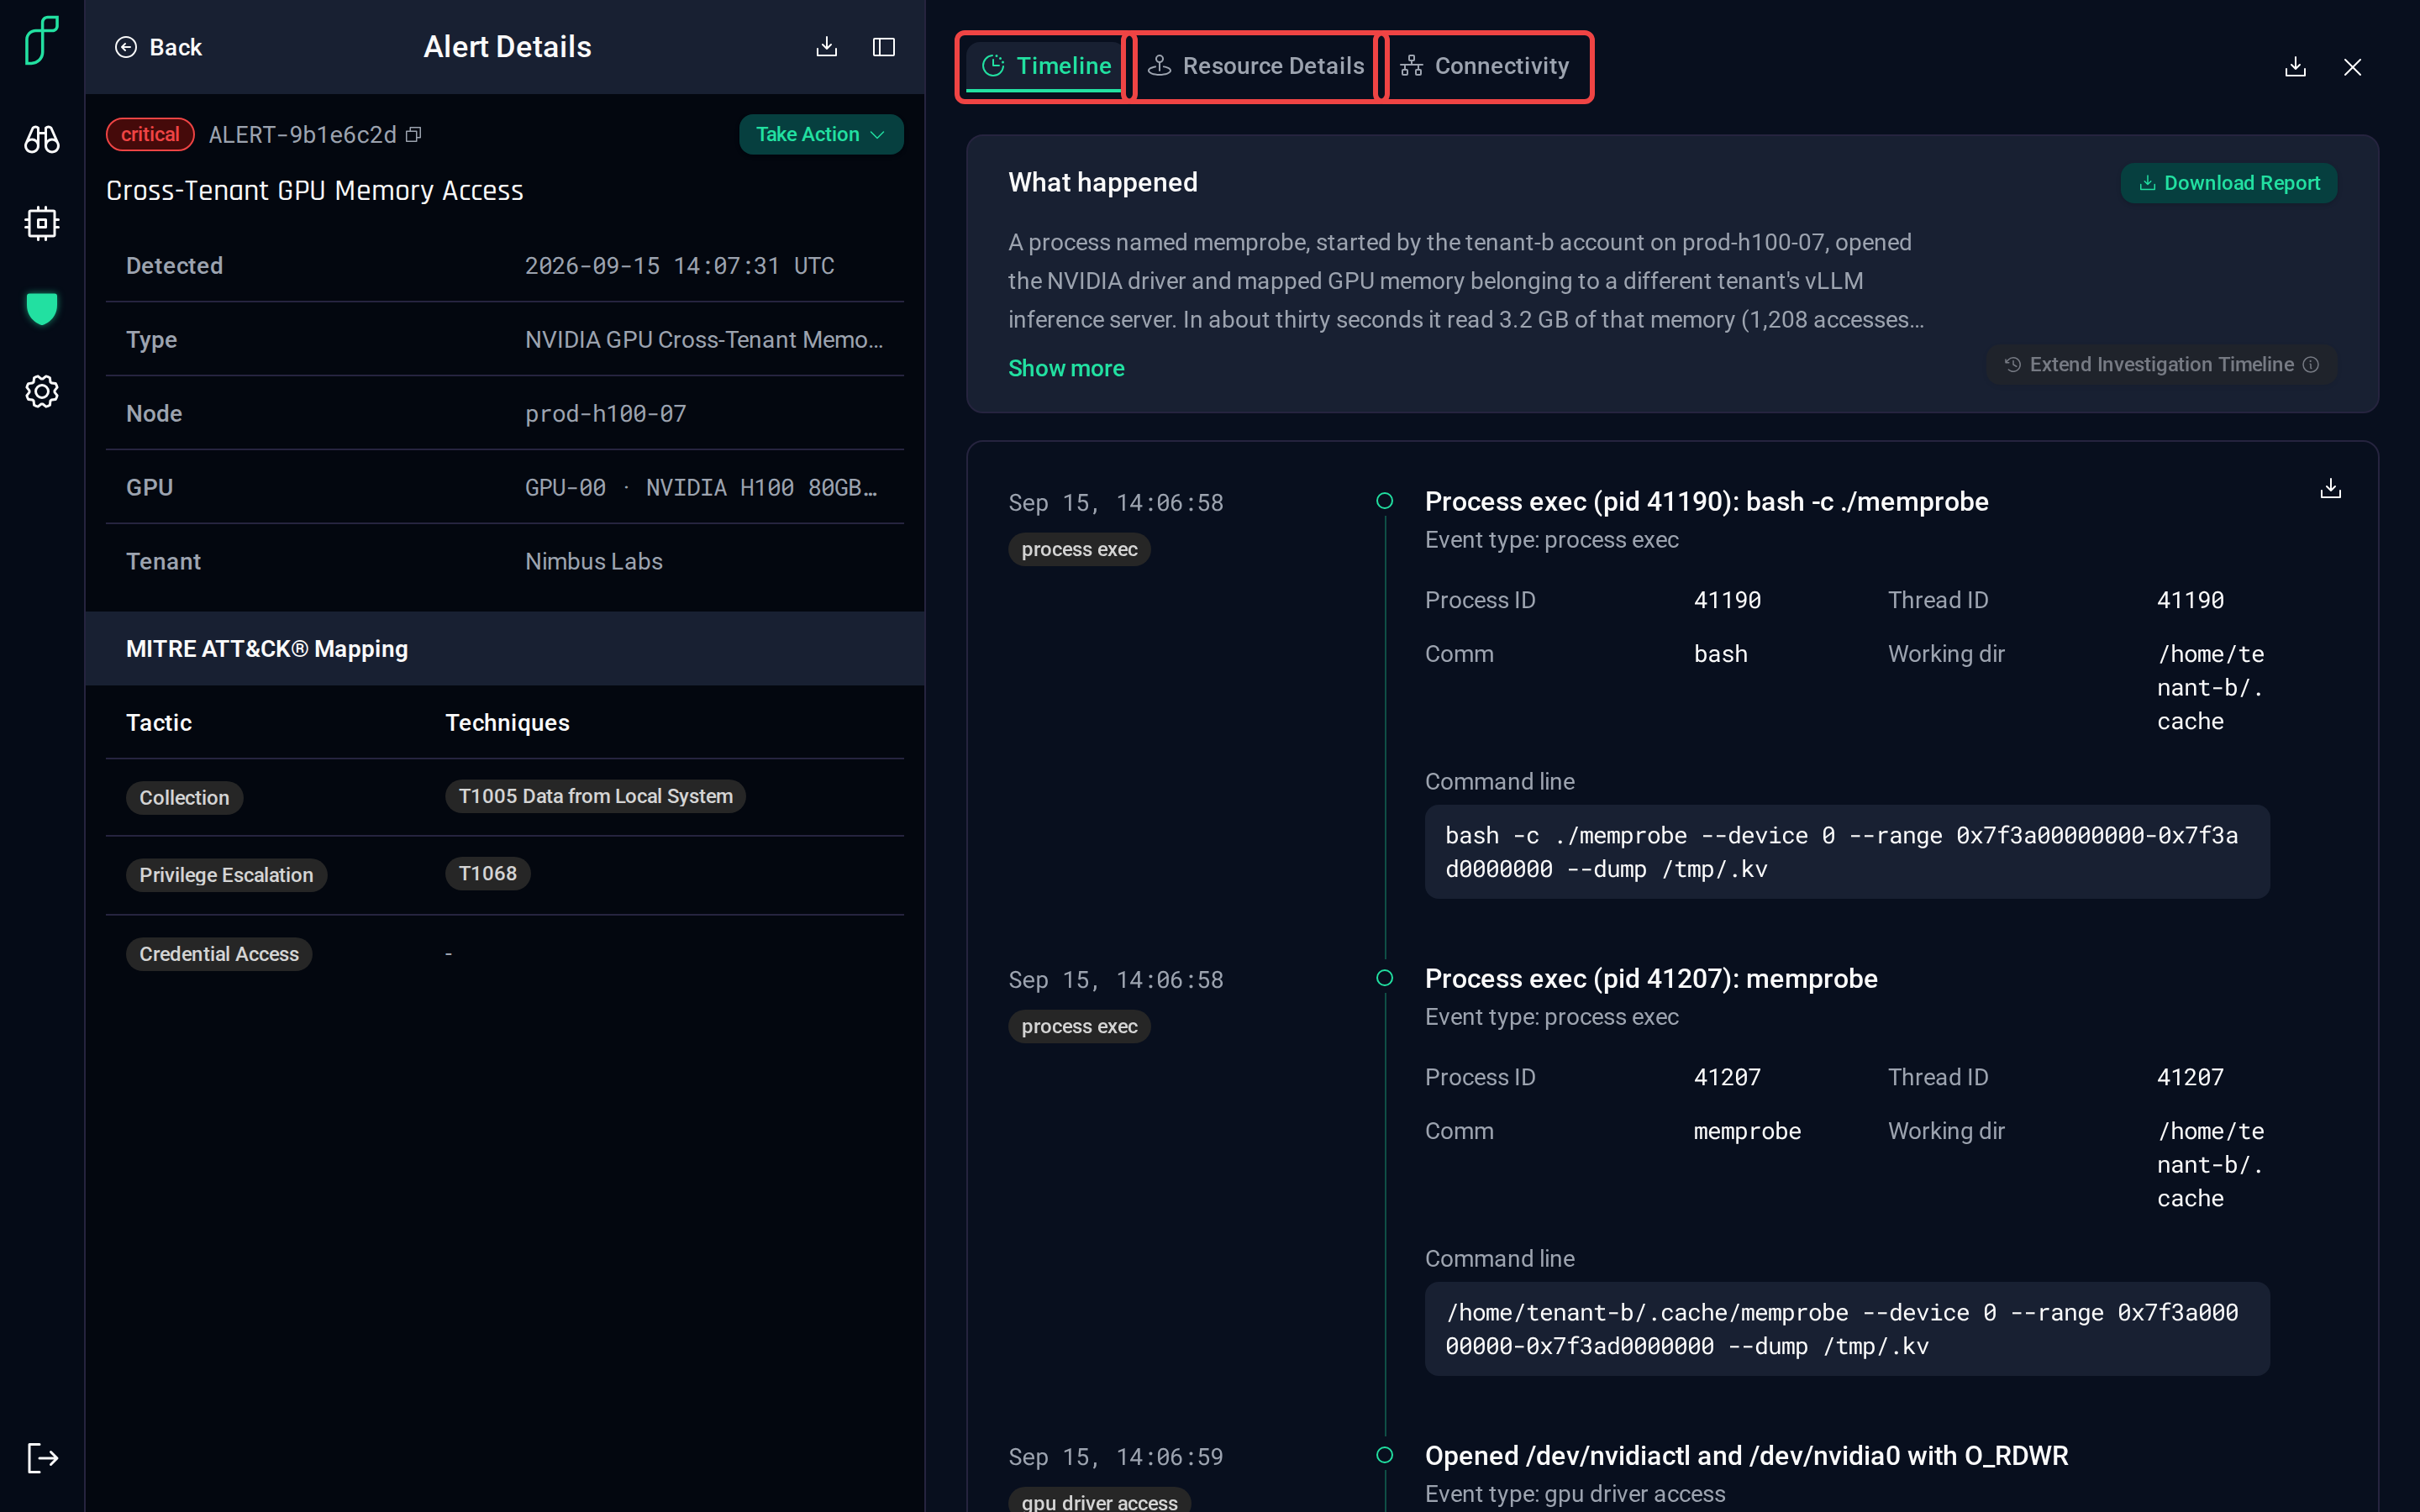
Timeline — What happened in plain language, then the process-level events leading up to the alert.
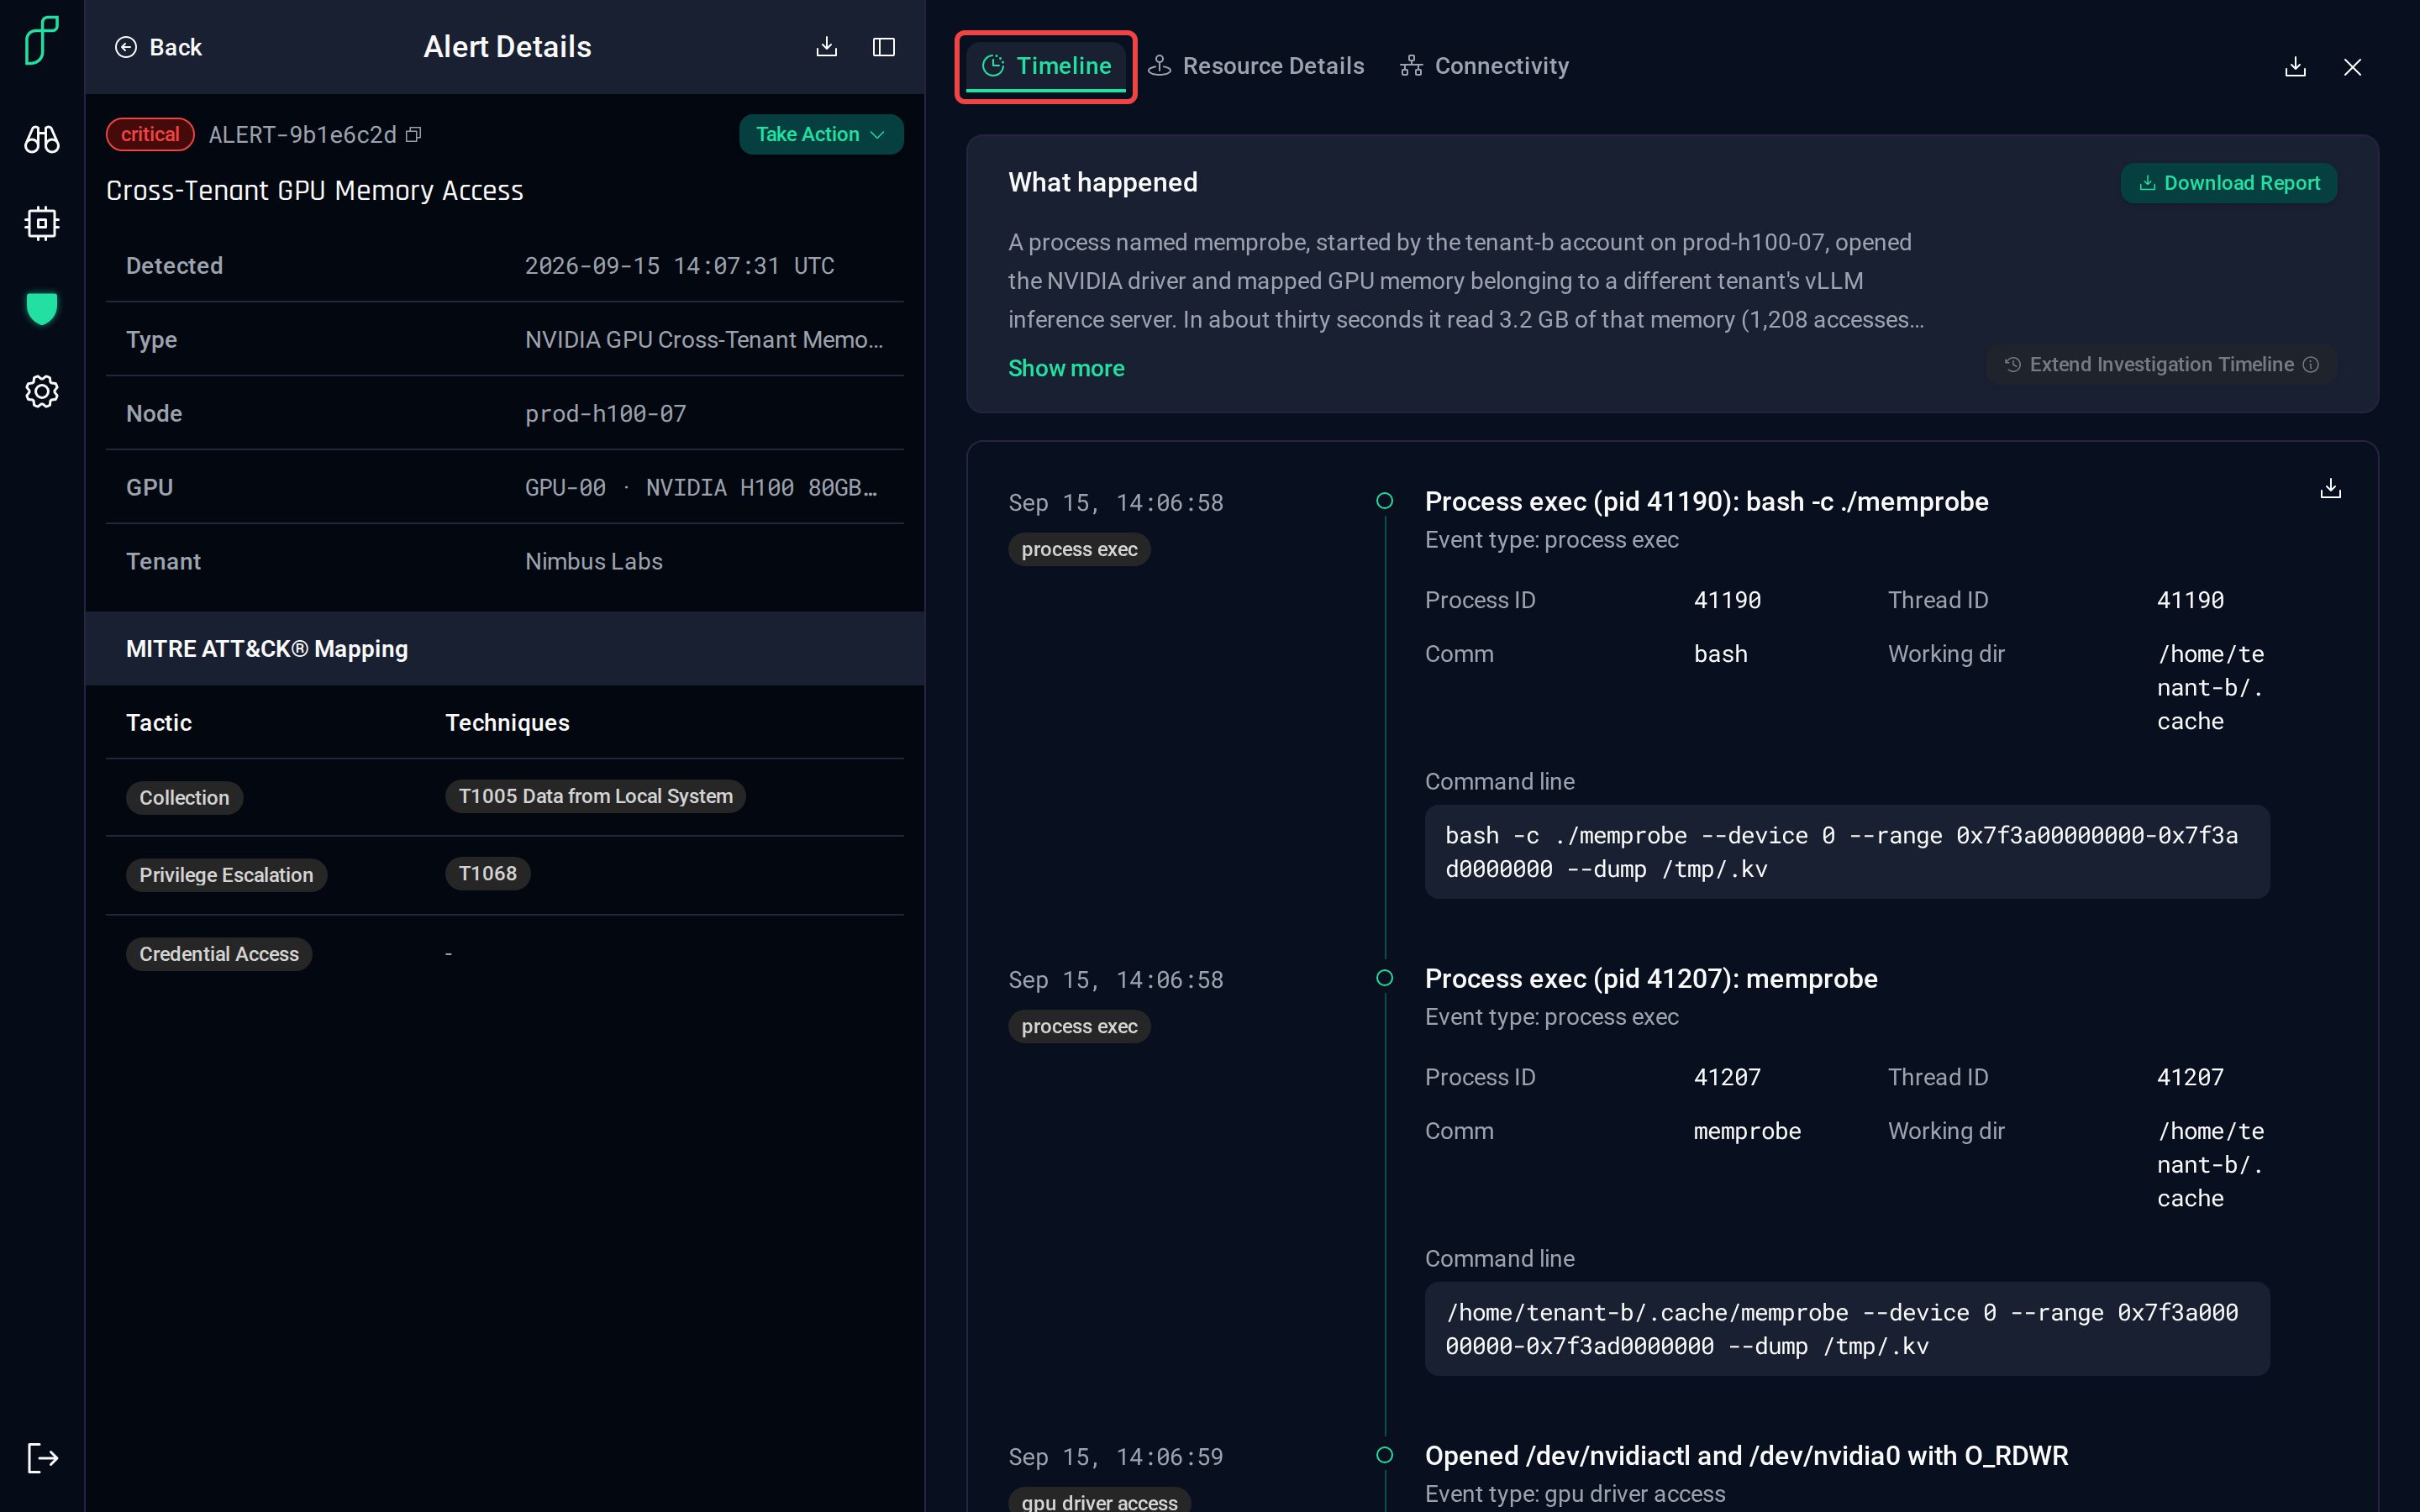
Resource Details — the process, memory, node and GPU as they were at the moment of the alert.
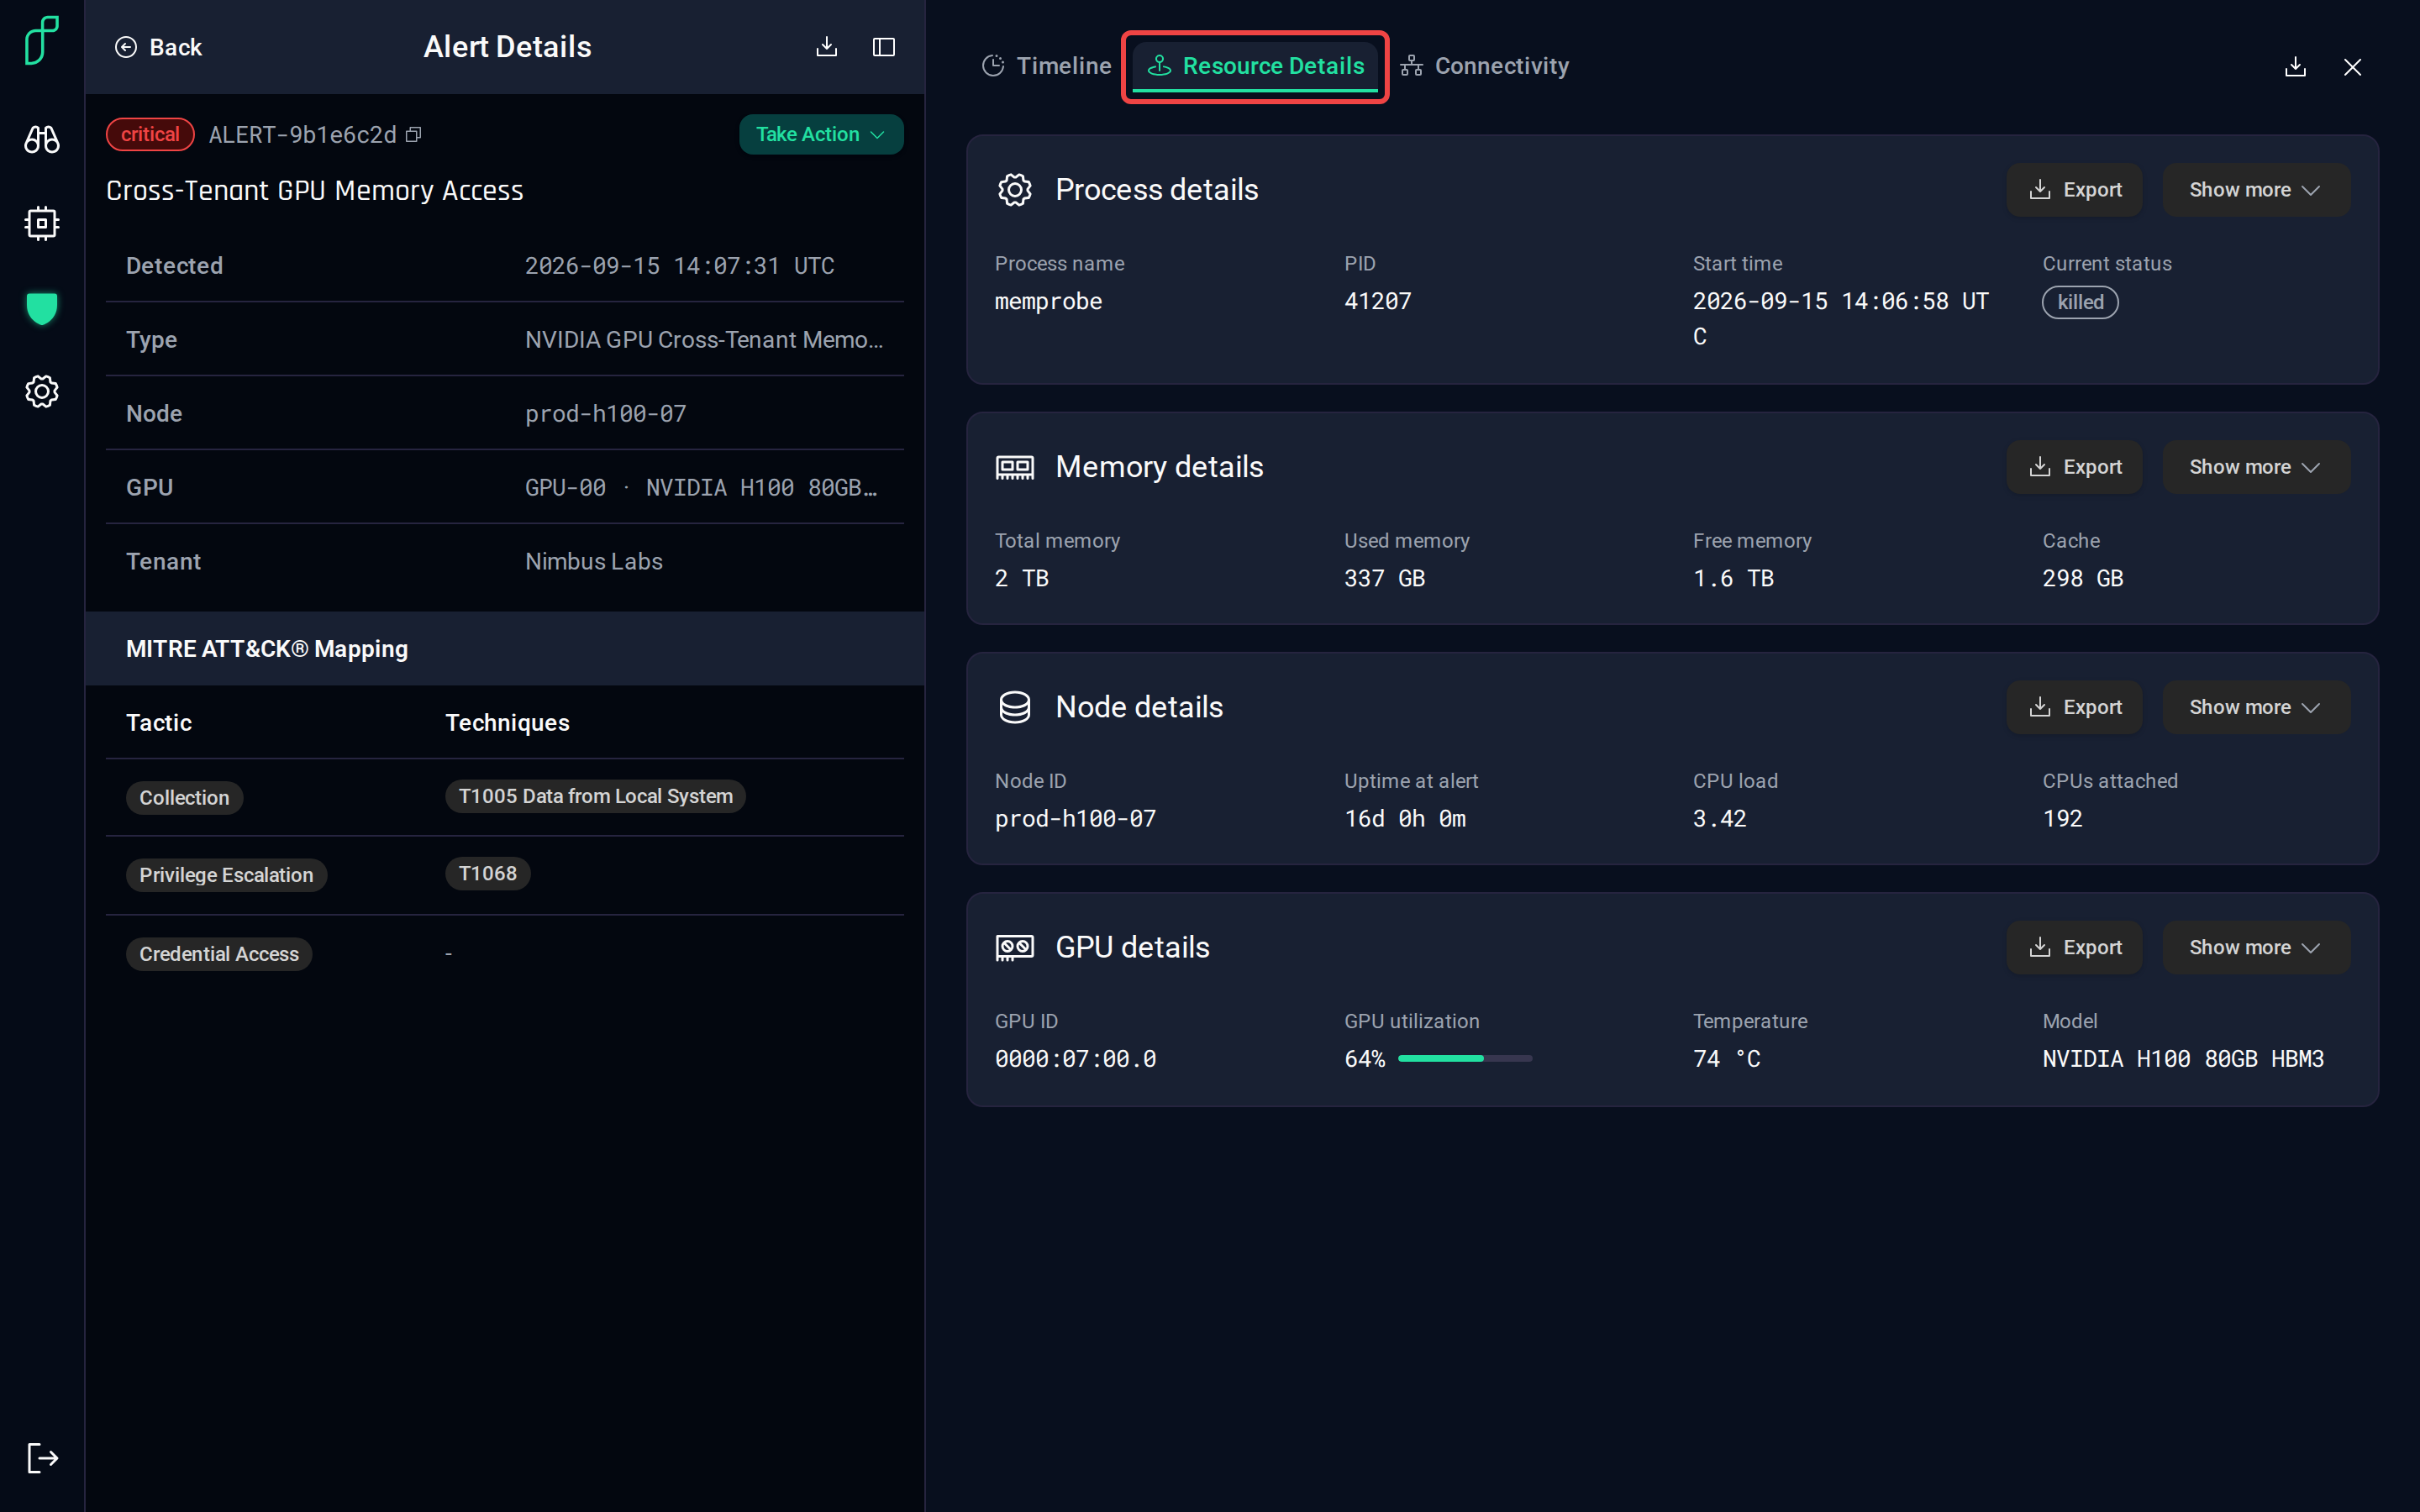
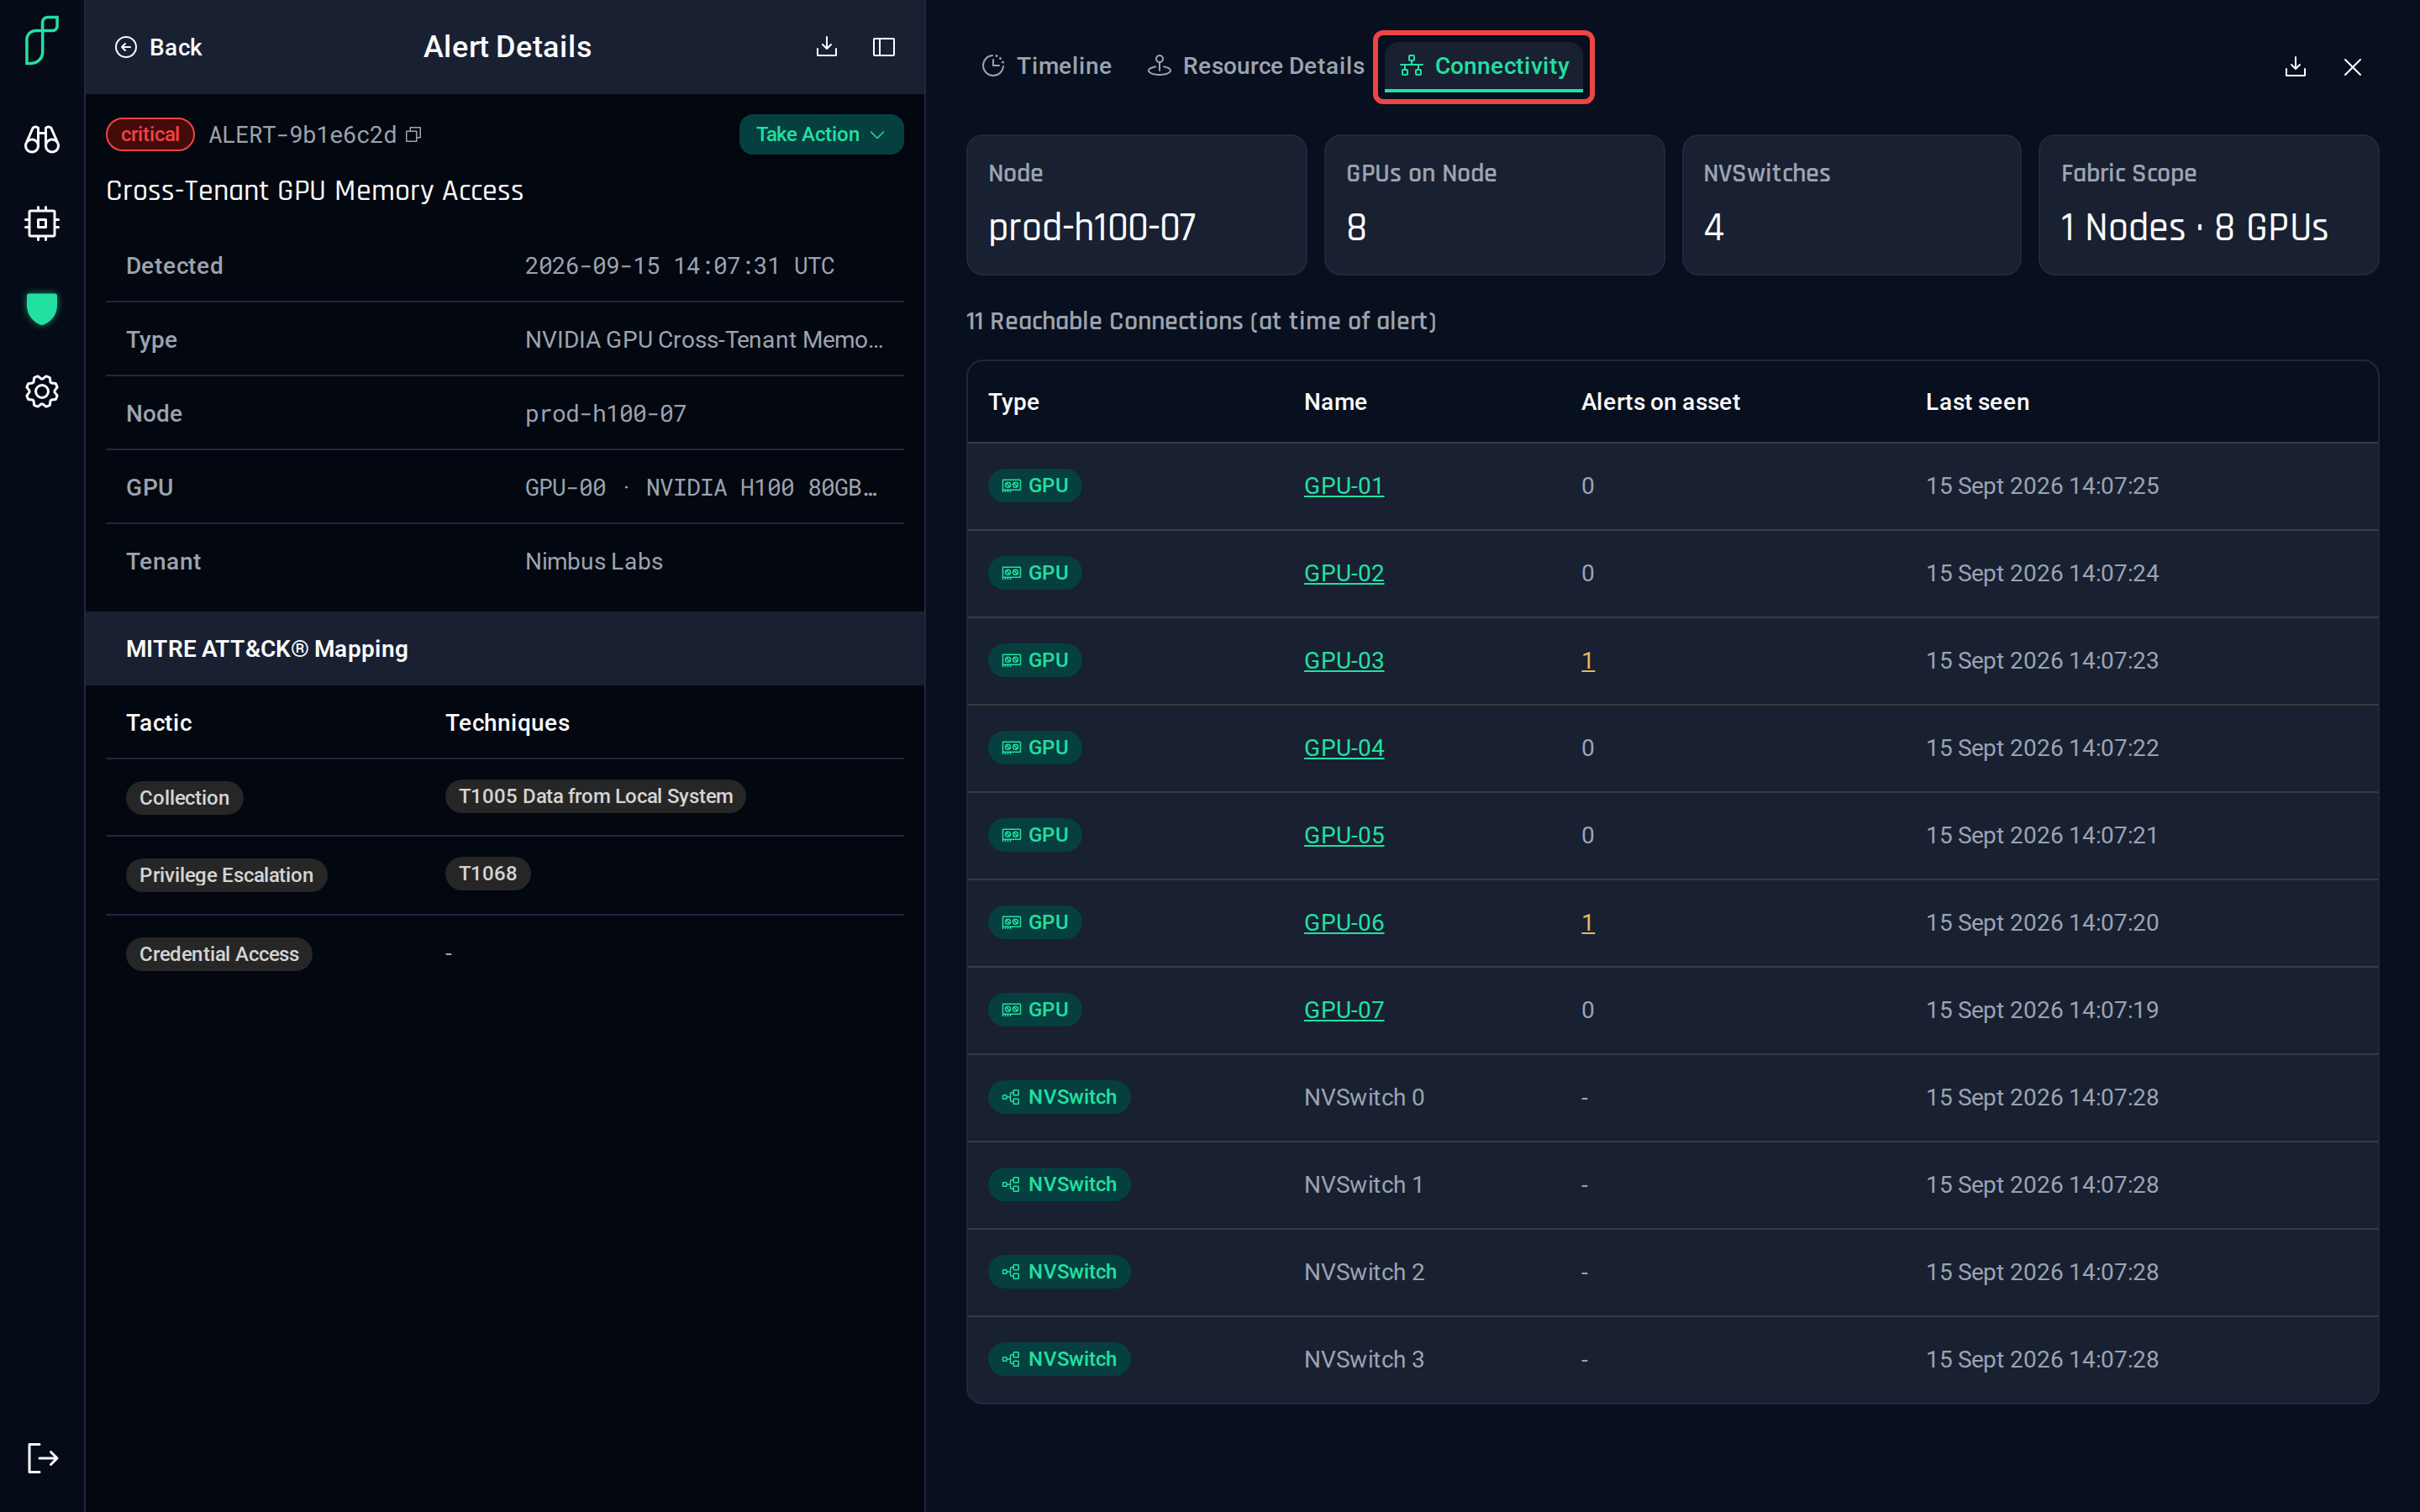
Connectivity — the host's NVLink neighbourhood at the time of the alert: the other GPUs on the node, the switches between them, and which of them carry alerts of their own.
Reports and actions
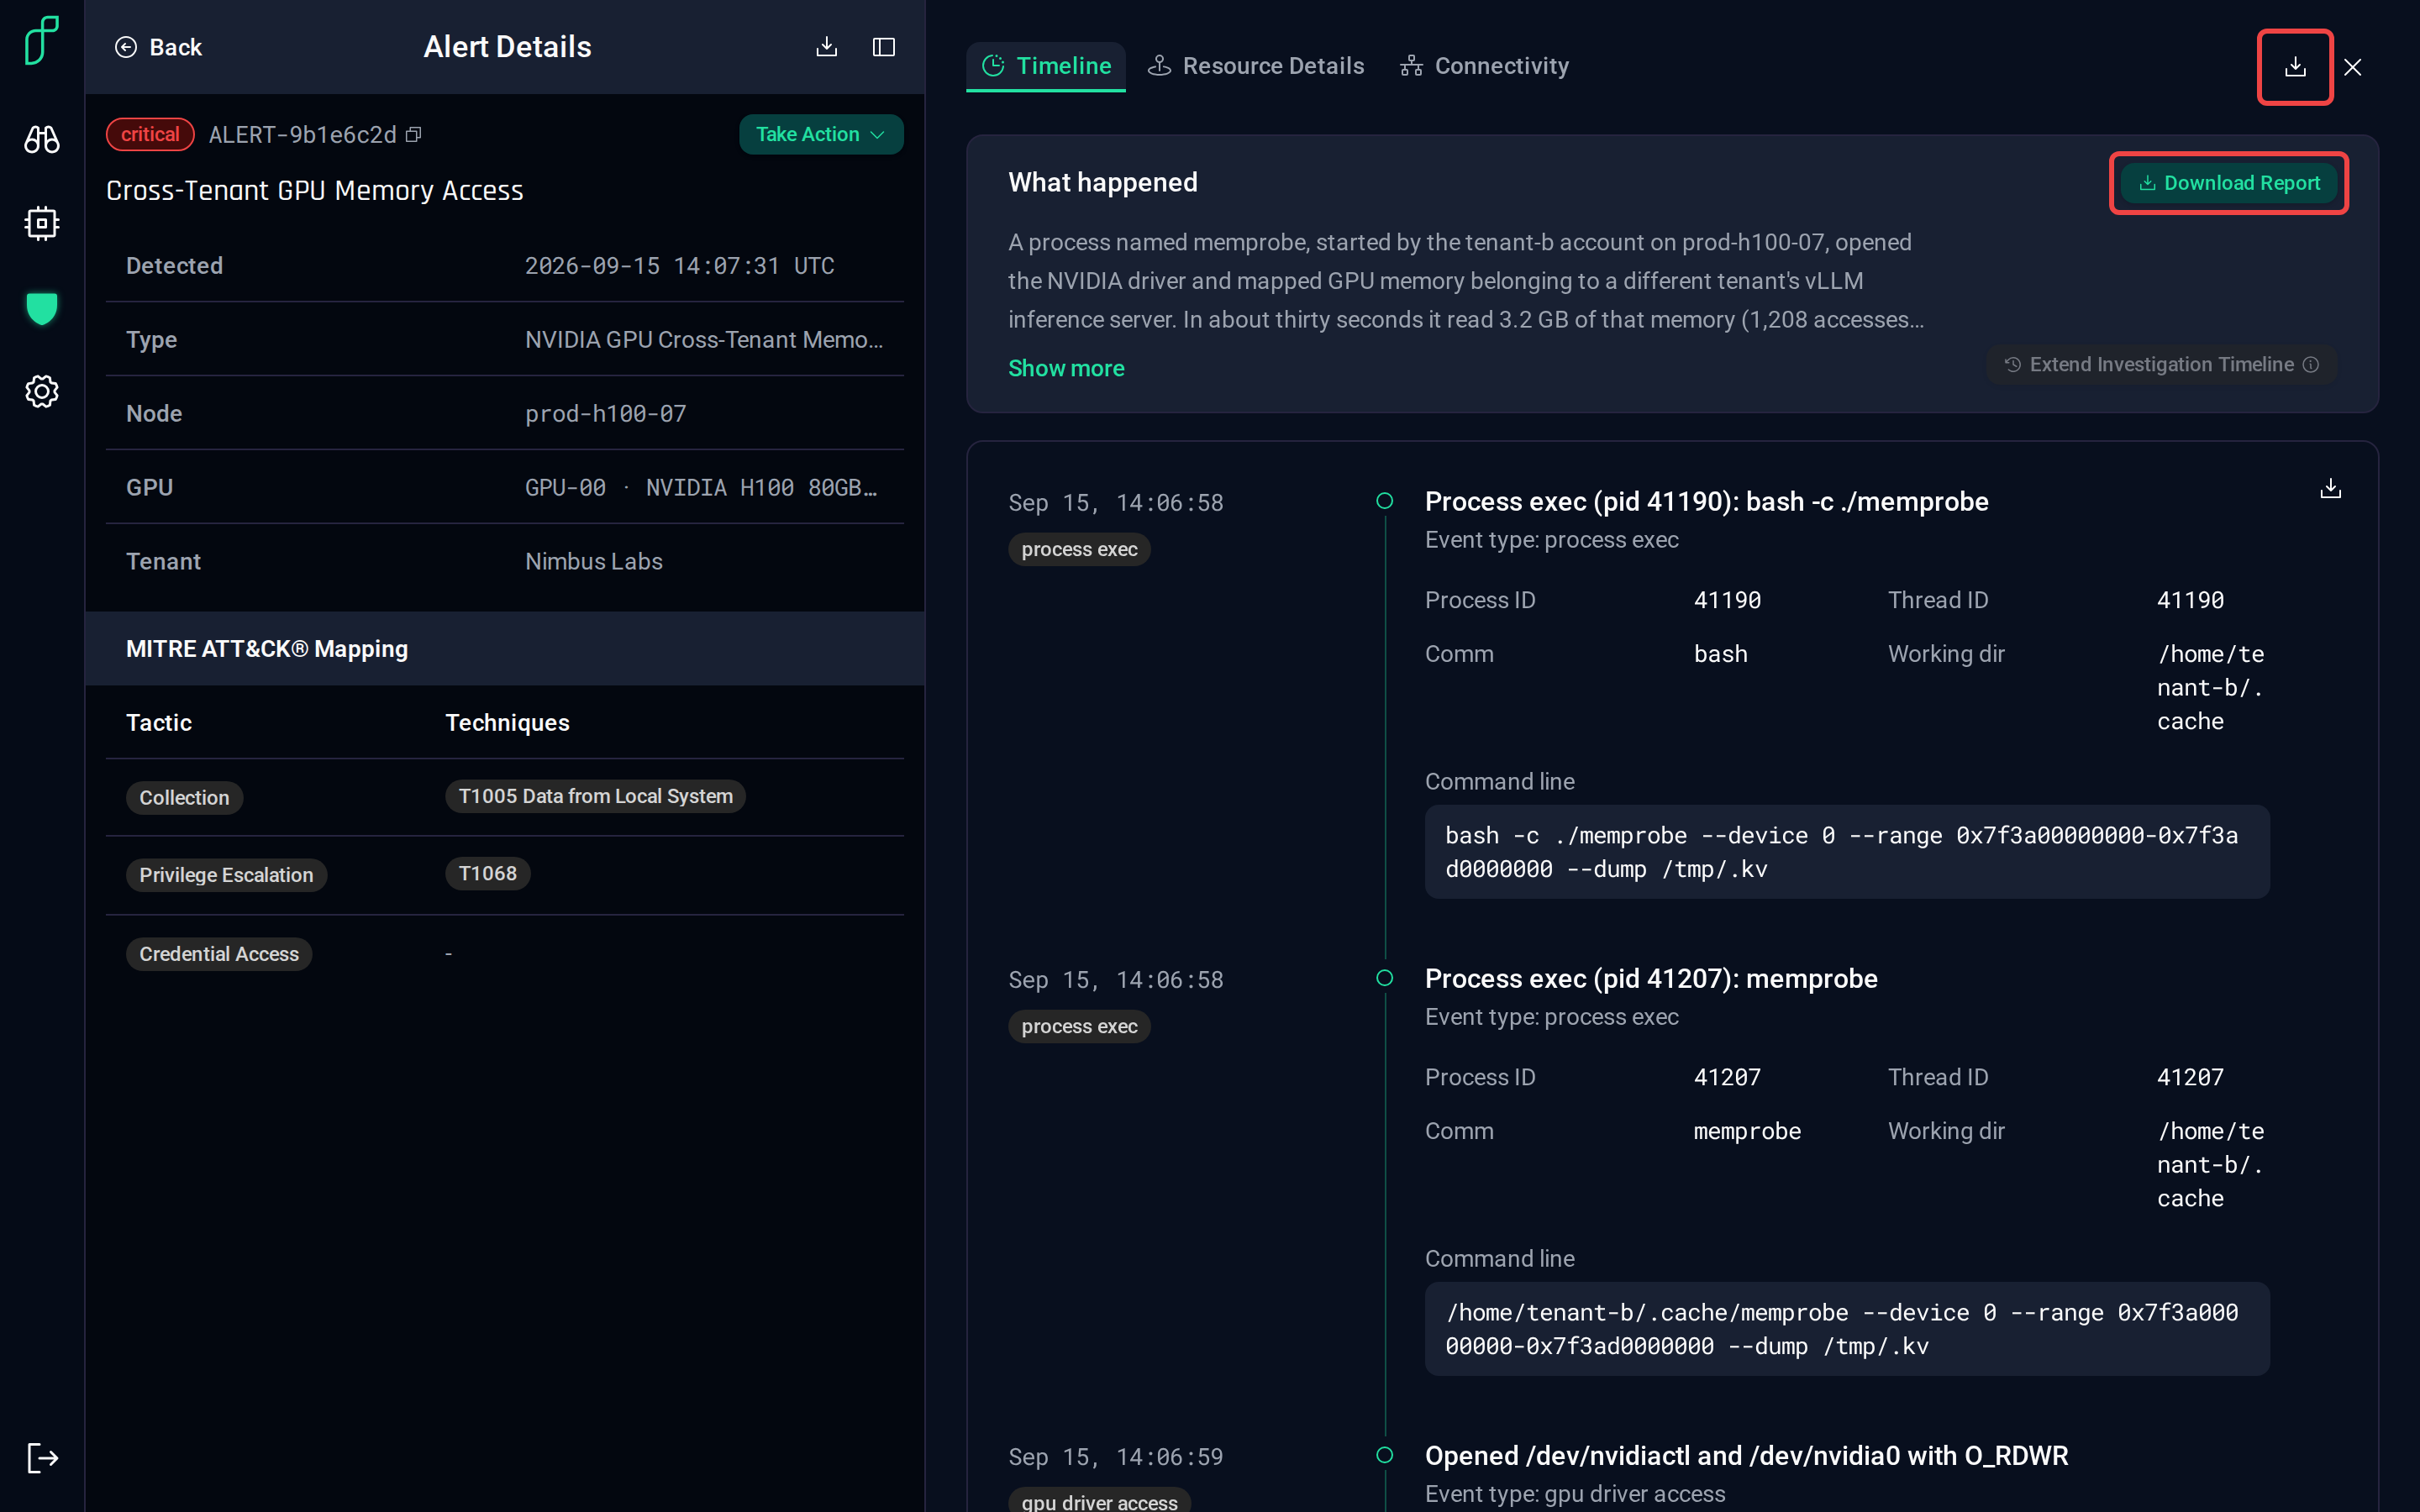
Download Report produces a printable report of the alert; the panel's download icon exports its fields as CSV.
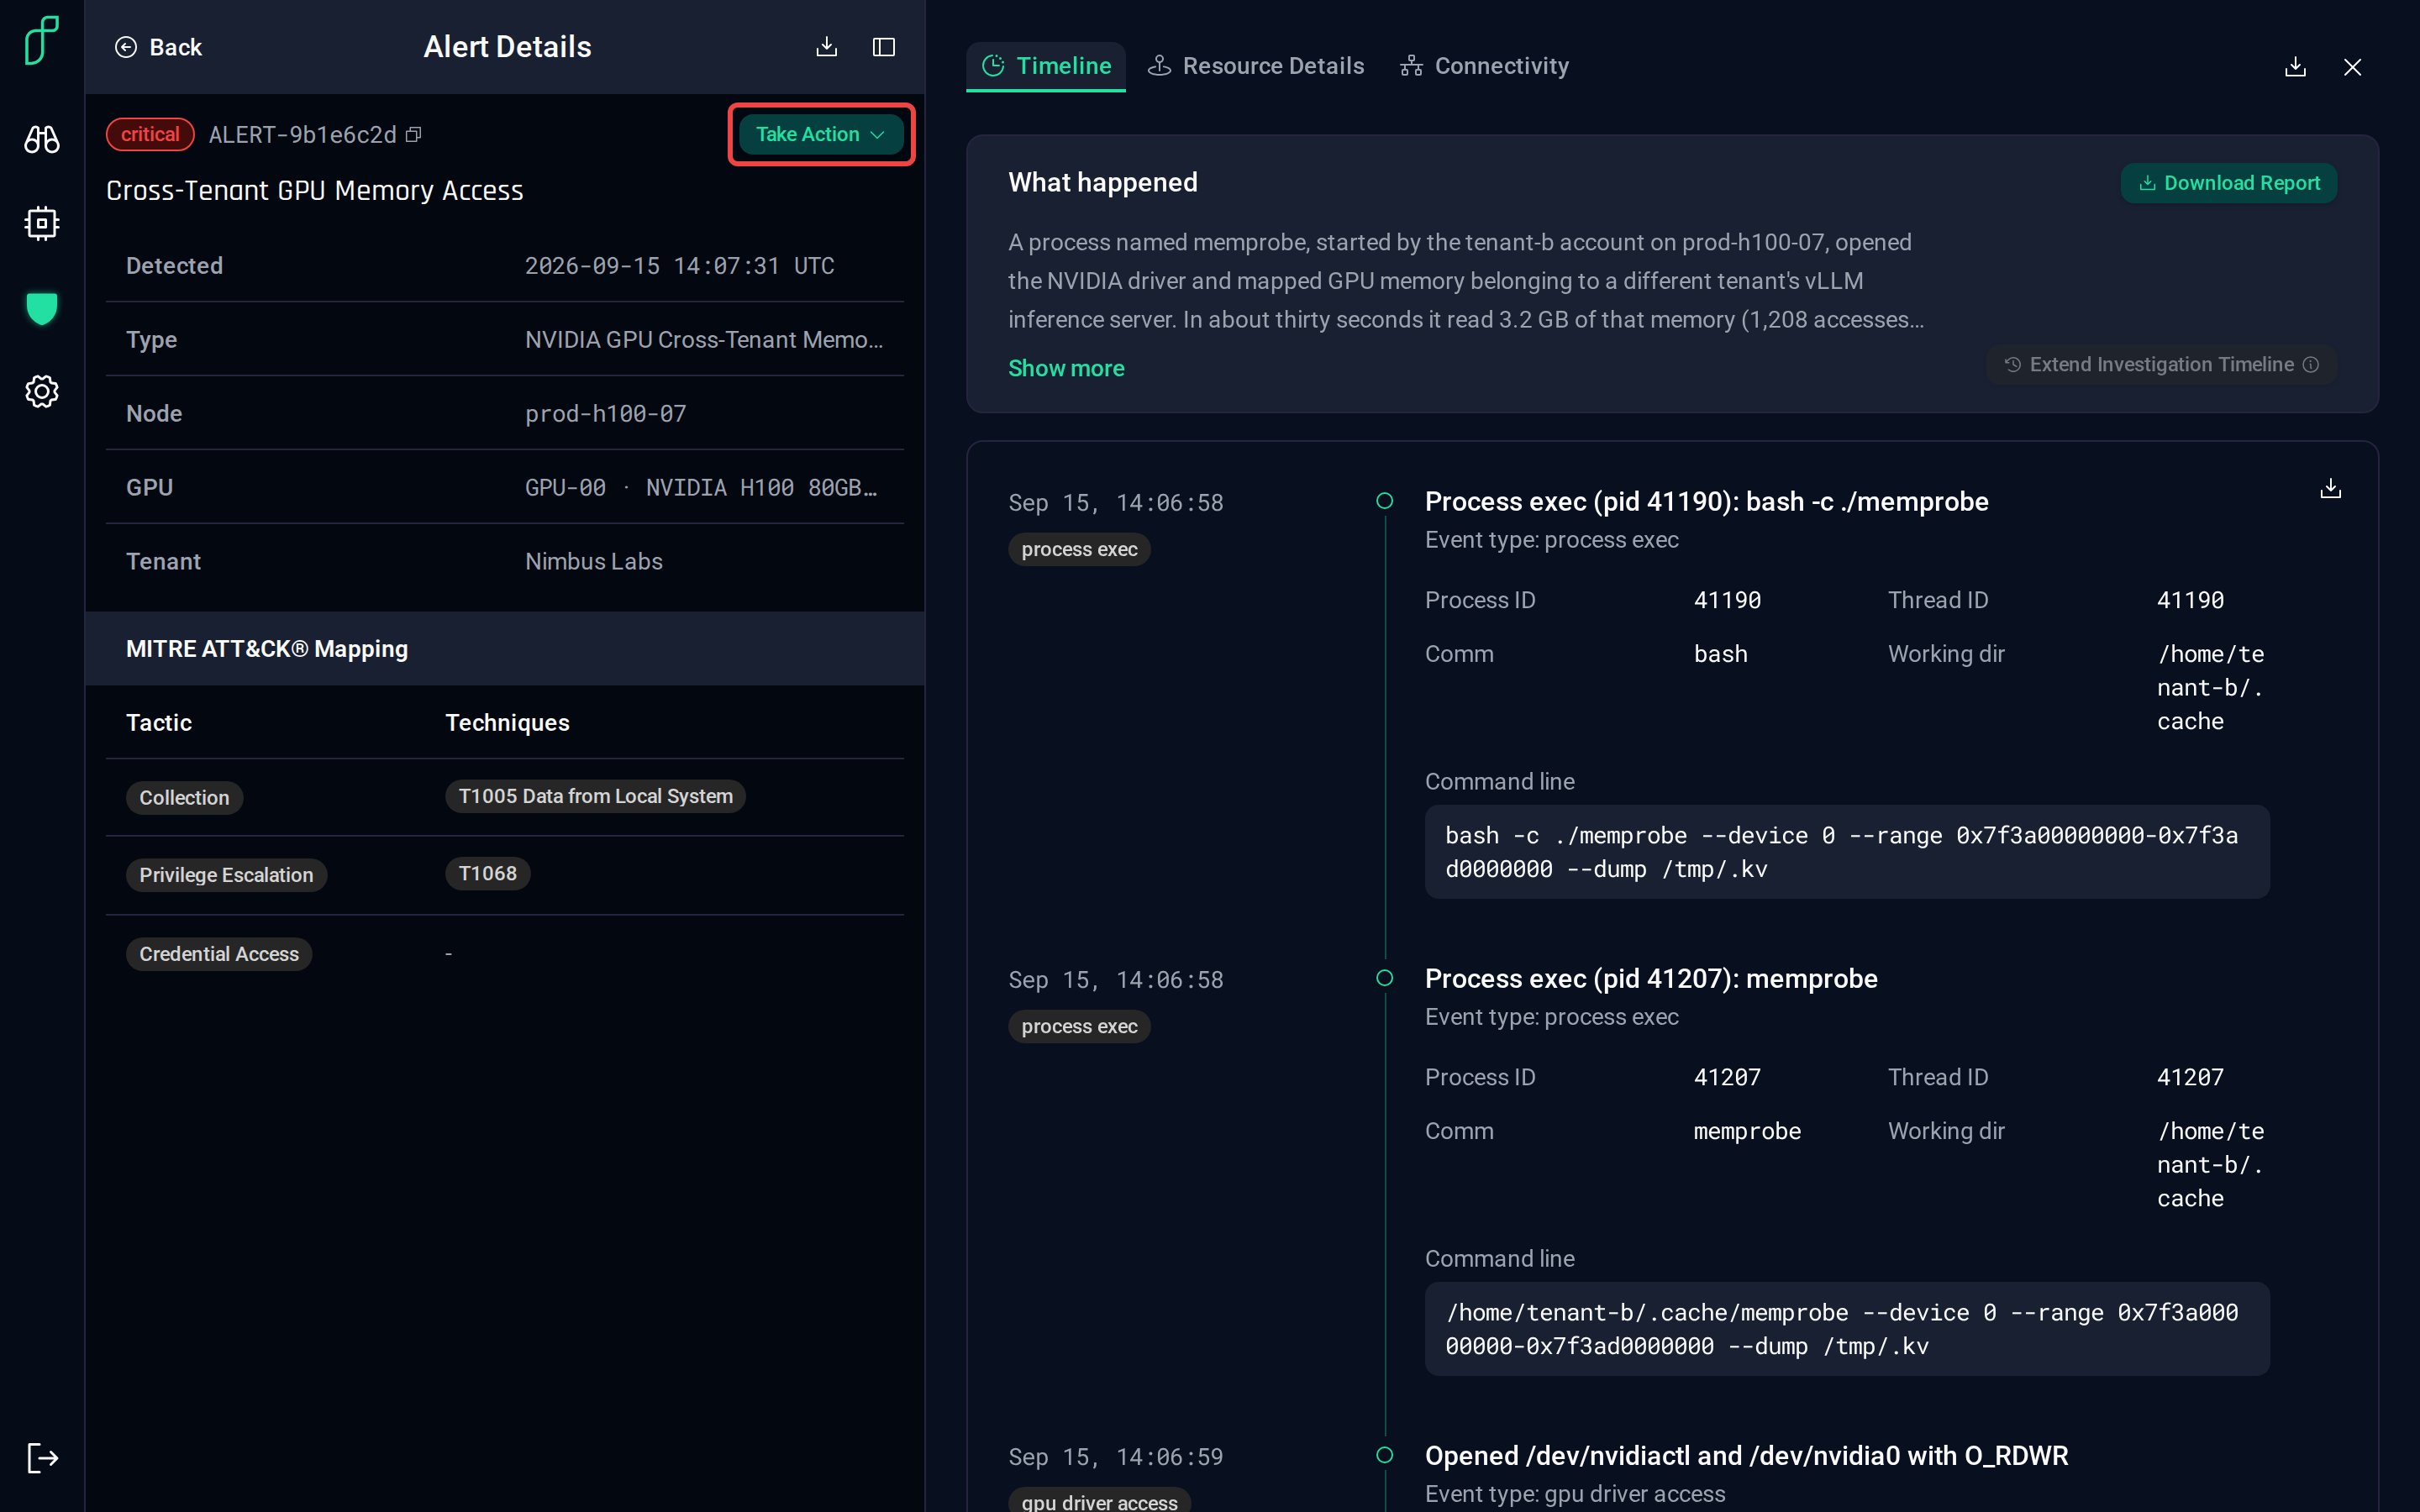
When the alert names a GPU, Take Action offers the same isolate and reset commands as the Compute Index.
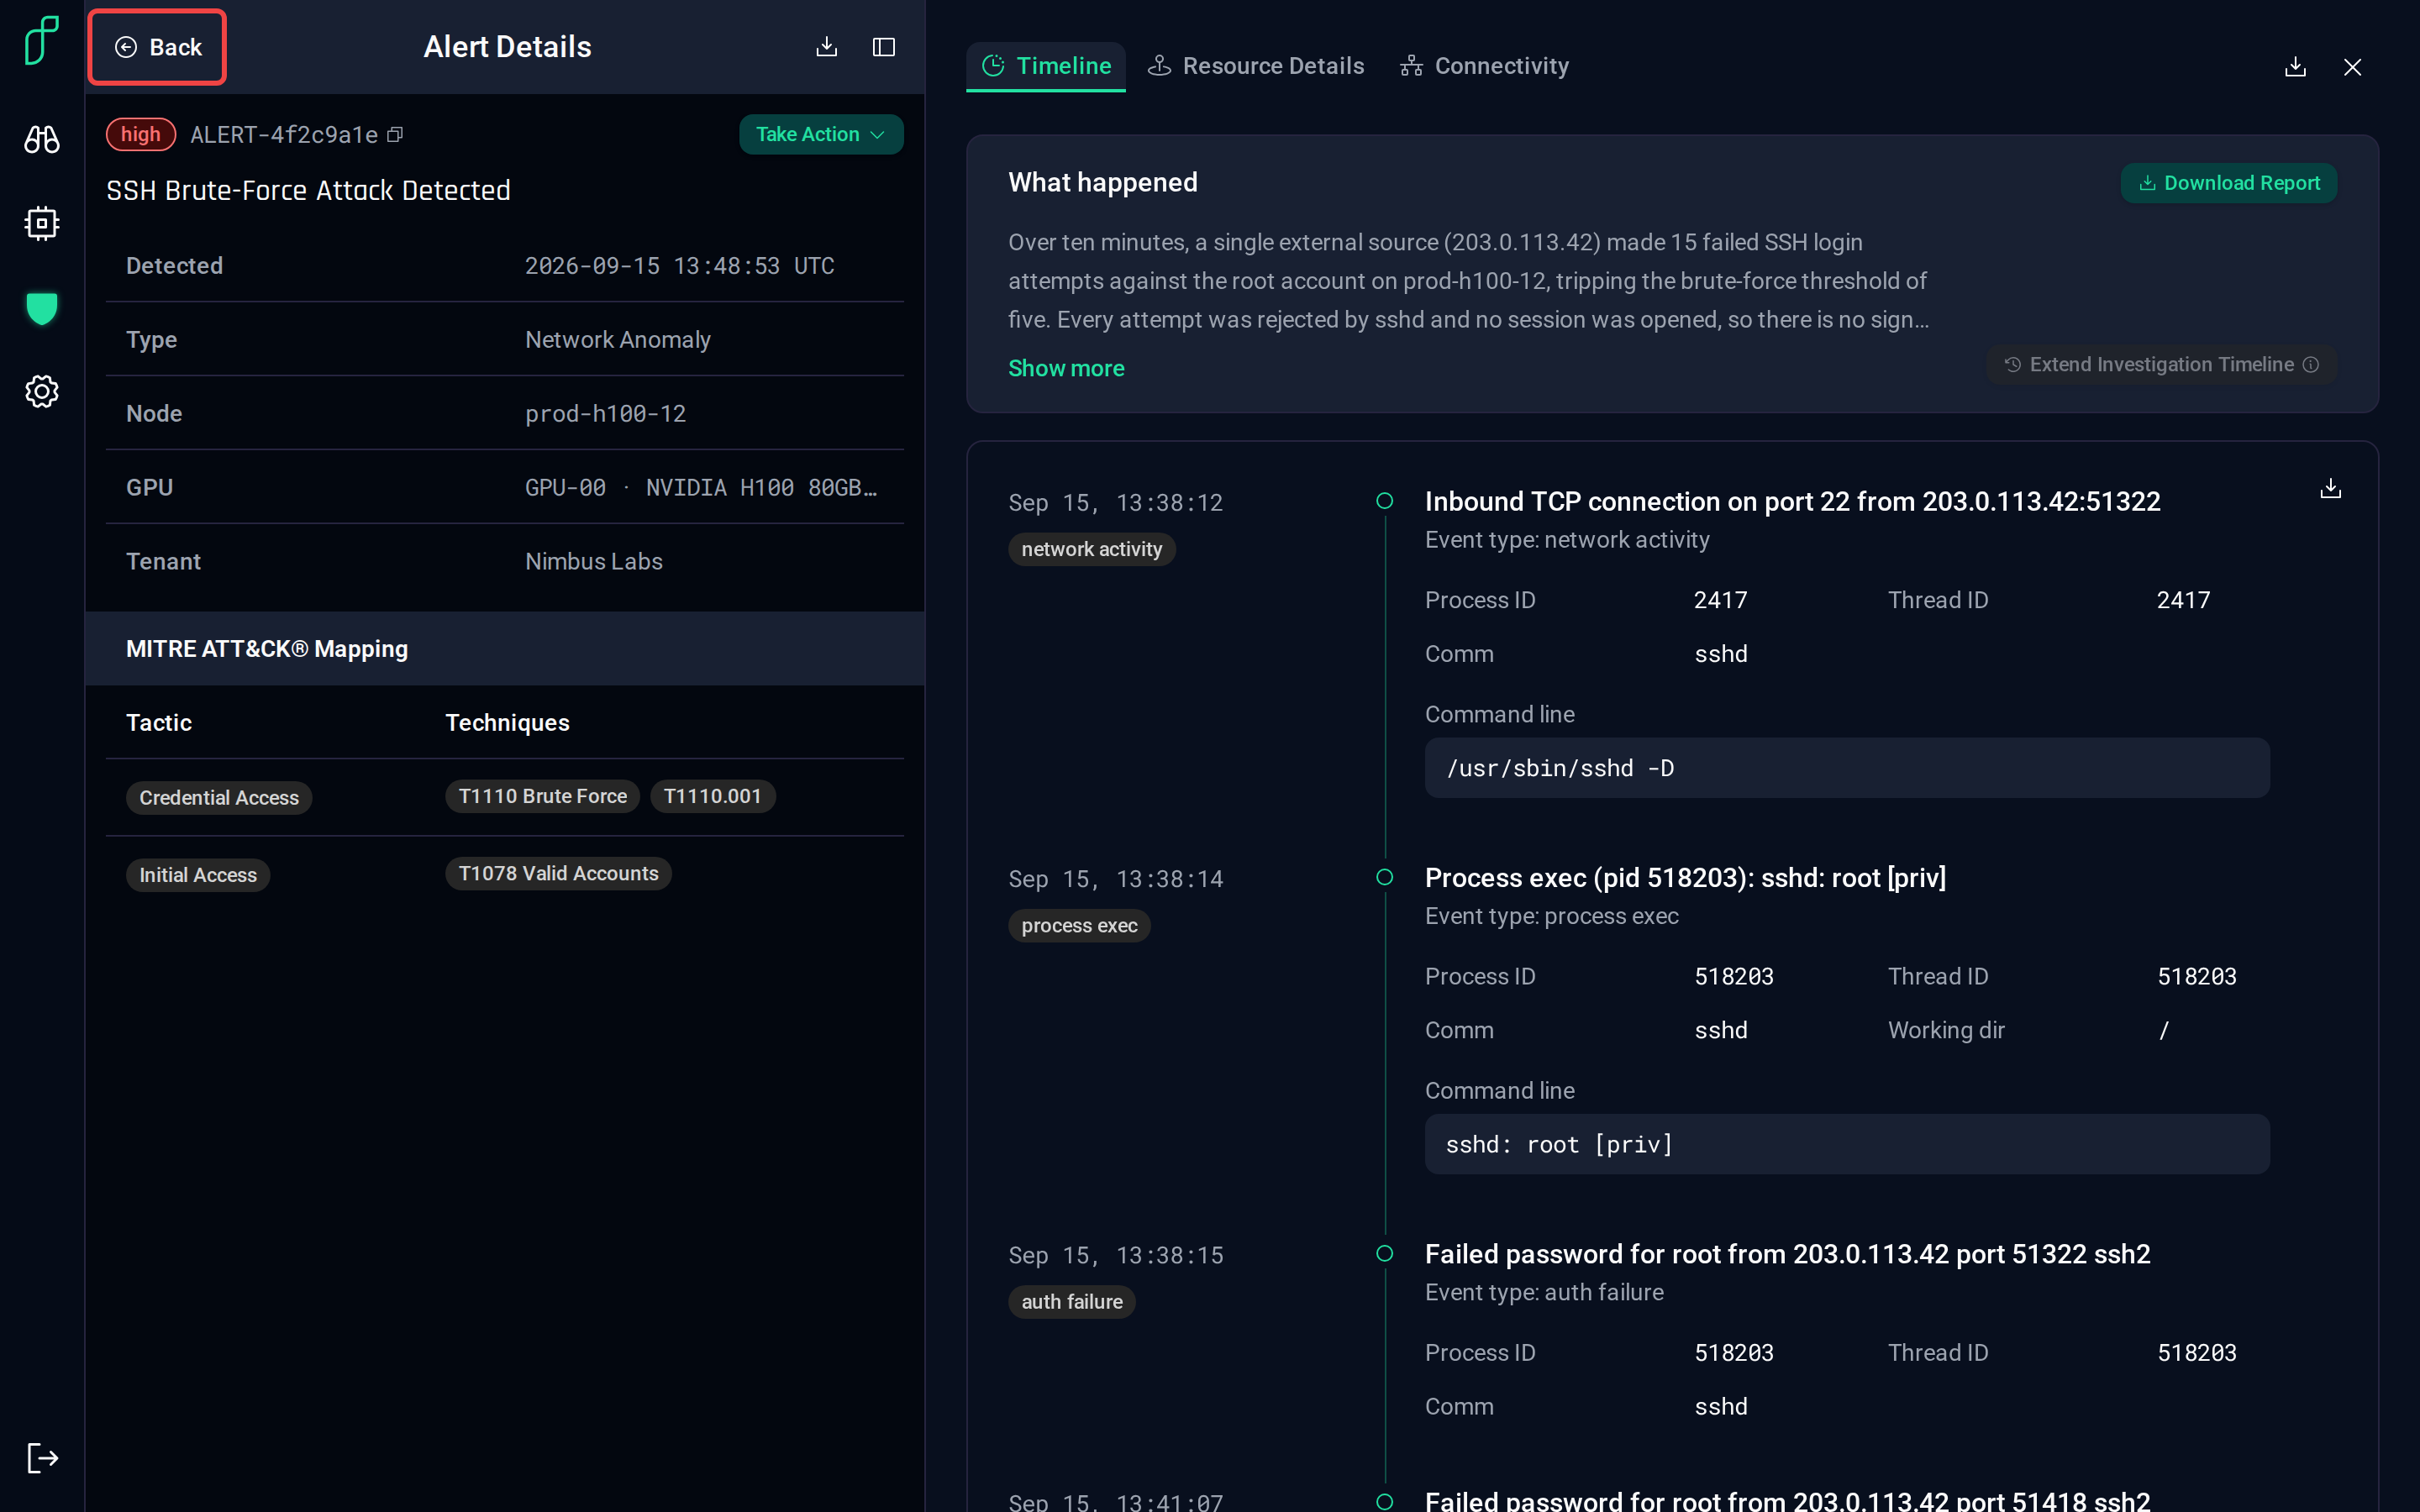
Back returns to the list, on the same workspace and time range you came from.
Going deeper
- Every alert on this page is an API call away:
GET /alertstakes the same filters, and the examples page through them and build severity breakdowns. - Ask an assistant to triage instead: the MCP server lists, reads and summarizes alerts; see Tools and the triage examples.
- Send alerts to the SIEM your SOC already watches: see Integrating with Your Environment and the SIEM export tab.